The NR7 Breakout on ES Loses 74% of Its Profit to One Fill Rule
Filled at the level, the narrowest-range-in-seven breakout on 12.5 years of S&P 500 futures takes 518 trades at +$442.60 each, +$229,269 total, t = 6.85. Filled at max(level, next open), the same 518 trades pay +$116.11 each and t = 2.10, because $169,125 of the result was overnight gaps through a price nobody could have bought. The premise is backwards too: the session after an NR7 day averages 34.95 points of range against 40.31 after every other day. And 9.8% of 500 placebo runs on ordinary days beat what survives.
Filled at the breakout level, the NR7 setup on twelve and a half years of S&P 500 futures returns +$442.60 a trade at t = 6.85. Filled at max(level, next open) instead, the identical 518 trades return +$116.11. The difference is $169,125 of overnight gaps through a price nobody could have traded.
That is one of three ways this article’s result gets manufactured. The other two are a measurement window that grows with the thing it measures, and the fact that NR7 is one cell of a family somebody already picked through. None of them is fraud. All three are one line of code.
The rule
- ES regular-session daily bars, 2 January 2014 to 10 September 2026, 3,224 sessions.
- An NR7 day is a day whose high-minus-low is the smallest of the trailing seven. There are 534 of them.
- On the next session, buy on a trade through the NR7 day’s high, sell short on a trade through its low. First side touched wins; 518 of the 534 signal days saw one side go.
- Exit on that session’s close. No stop, no target, one contract.
- Costs are in every figure: $4.50 commission plus two ticks, and a tick on ES is $12.50, so $29.50 a round trip.
The only thing that changes between the first two runs below is the entry price.
One: the fill
The optimistic version books the entry at the level. That is the version most breakout backtests ship with, because writing entry = level is easier than writing the alternative and the equity curve looks better afterwards.
| filled at the level | filled at max(level, open) | |
|---|---|---|
| trades | 518 | 518 |
| win rate | 64.7% | 56.2% |
| average | +$442.60 | +$116.11 |
| median | +$239.25 | +$83.00 |
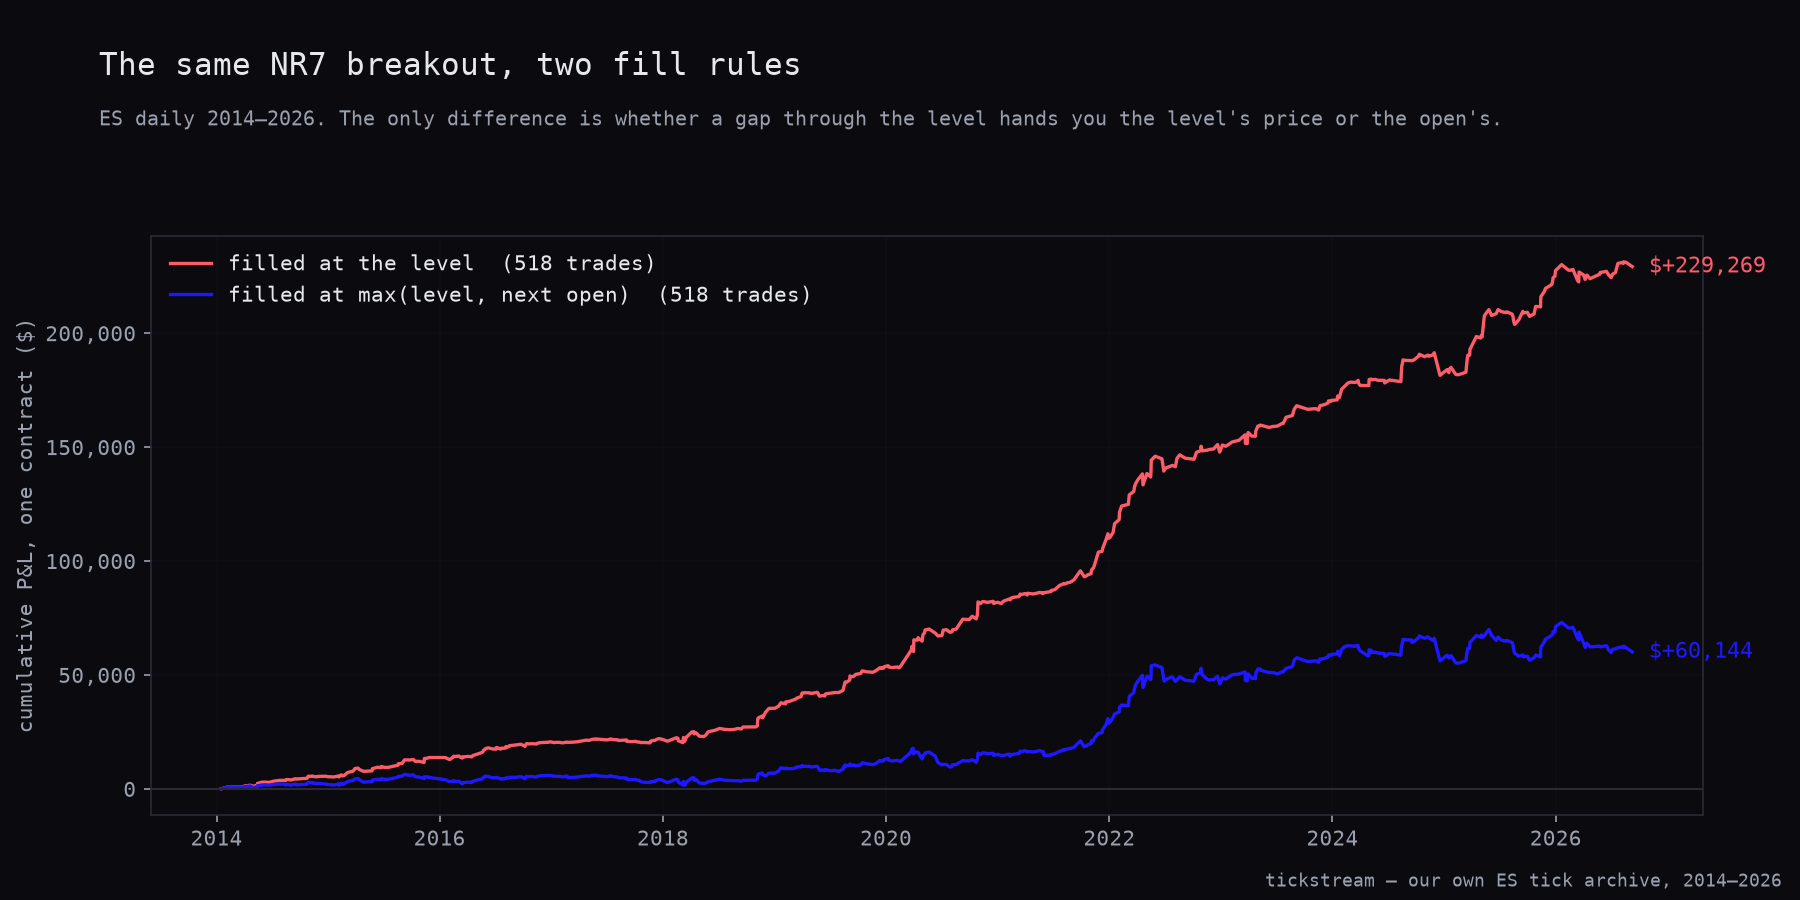
| total | +$229,269 | +$60,144 |
| profit factor | 2.73 | 1.342 |
| max drawdown | $9,929.50 | $13,492.50 |
| Sharpe | 1.92 | 0.59 |
| t | 6.85 | 2.10 |
| p | rounds to zero | 0.0359 |
The left column is a publishable strategy by any normal standard. The right column is the same 518 trades on the same 518 days.
The difference is $169,125, which is 74% of the original total, and all of it comes from sessions that opened past the level. On those days the market never offered the level’s price. The backtest bought it anyway and pocketed the gap.
The chart below is the two cumulative P&L curves, one contract, same trade dates on both lines. The red line is the level fill, the saturated blue line the honest one. What to look at is not the endpoint gap but the shape: the honest curve is not a shrunken version of the optimistic one, it is a different curve with flat stretches where the other one steps up.
We adopted max(level, open) as a standing rule after our NQ session audit found that our own live NR4 and NR5 sleeves were exactly this artefact, and retired them from the board. Every breakout test in this series has used it since. This article is the ES version of that mistake, run deliberately, so the size of it is on the record for a market with five more years of history than the one we caught it in.
Two: the premise is backwards
Before pricing the breakout, the setup’s own claim is worth checking. NR7 is sold as a contraction that precedes an expansion. On ES it precedes a contraction.
| next session’s range | after NR7 | after all other days |
|---|---|---|
| average, points | 34.95 | 40.31 |
| ratio | 0.867 | — |
| t | −3.75 | — |
| p | 0.0002 | — |
Narrow days are followed by narrow days. A quiet day also tends to sit inside a quiet week, so we normalised each next-day range against the trailing twenty-day average range to stop the same calm being counted twice. It gets stronger, not weaker: 0.854 after NR7 against 1.068 after other days, t = −9.03.
This is volatility clustering, which is one of the oldest measured facts about price series, and it is the opposite of what the setup claims. Whatever the breakout earns, it does not earn it by predicting an expansion. The expansion is not there.
Three: the family and the placebo
A t of 2.10 in the only cell there was would be worth something. A t of 2.10 in the cell somebody already selected out of a family is worth less, and the way to find out how much less is to run the whole family with the same honest fill.
| lookback | signal days | trades | win rate | average | total | PF | t | p |
|---|---|---|---|---|---|---|---|---|
| NR4 | 902 | 866 | 54.4% | +$79.22 | +$68,603 | 1.219 | 1.84 | 0.0663 |
| NR5 | 740 | 713 | 53.3% | +$76.02 | +$54,204 | 1.209 | 1.58 | 0.1151 |
| NR7 | 534 | 518 | 56.2% | +$116.11 | +$60,144 | 1.342 | 2.10 | 0.0359 |
| NR10 | 403 | 391 | 55.2% | +$139.11 | +$54,390.50 | 1.432 | 2.34 | 0.0196 |
| NR14 | 300 | 295 | 52.5% | +$58.42 | +$17,235 | 1.175 | 0.92 | 0.3573 |
| NR20 | 215 | 212 | 50.9% | +$50.33 | +$10,671 | 1.153 | 0.71 | 0.4807 |
Every cell is positive, the per-trade figures run from +$50.33 to +$139.11, and two of six clear p = 0.05. That is the pattern of a weak common effect sampled six ways, not of one lookback doing something the others cannot.
The control that closes it takes the same number of ordinary days, drawn at random from the days that are not NR7 days, and breaks their high or low with the identical honest fill and identical costs. Five hundred runs:
| random-day placebo, 500 runs | |
|---|---|
| mean per trade | +$40.94 |
| 95th percentile per trade | +$134.16 |
| runs beating NR7’s +$116.11 | 9.8% |
NR7 sits inside its own noise band. The placebo’s 95th percentile is +$134.16, comfortably above NR7’s average. About one run in ten beats NR7 outright without any narrow range involved.
A reader will ask why the placebo pays anything at all, and the answer is the part worth keeping. Breaking yesterday’s high and holding to the close, in an index that spent most of these twelve and a half years going up, is a long-biased rule with an upward drift underneath it. That drift is the base rate. The narrow range adds nothing on top of it.
Four: a longer base does not make a bigger break
The second claim in this family is that the longer a market coils, the harder it goes when it leaves. We tested it on 5-minute bars inside the cash session, at five base lengths. Each break is measured two ways: once over a fixed twelve-bar horizon for every base, and once over a horizon that grows with the base. The growing ruler is how the claim is usually presented.
| base | breaks | median base | move, fixed 12-bar horizon | move, growing horizon | t fixed | t growing |
|---|---|---|---|---|---|---|
| 6 bars | 54,906 | 4.75 pts | −0.128 pts | −0.068 pts | −2.11 | −1.64 |
| 12 bars | 35,306 | 6.75 pts | −0.115 pts | −0.115 pts | −1.44 | −1.44 |
| 24 bars | 19,525 | 9.50 pts | −0.134 pts | −0.119 pts | −1.13 | −0.71 |
| 48 bars | 7,842 | 13.50 pts | +0.039 pts | −0.431 pts | 0.19 | −1.21 |
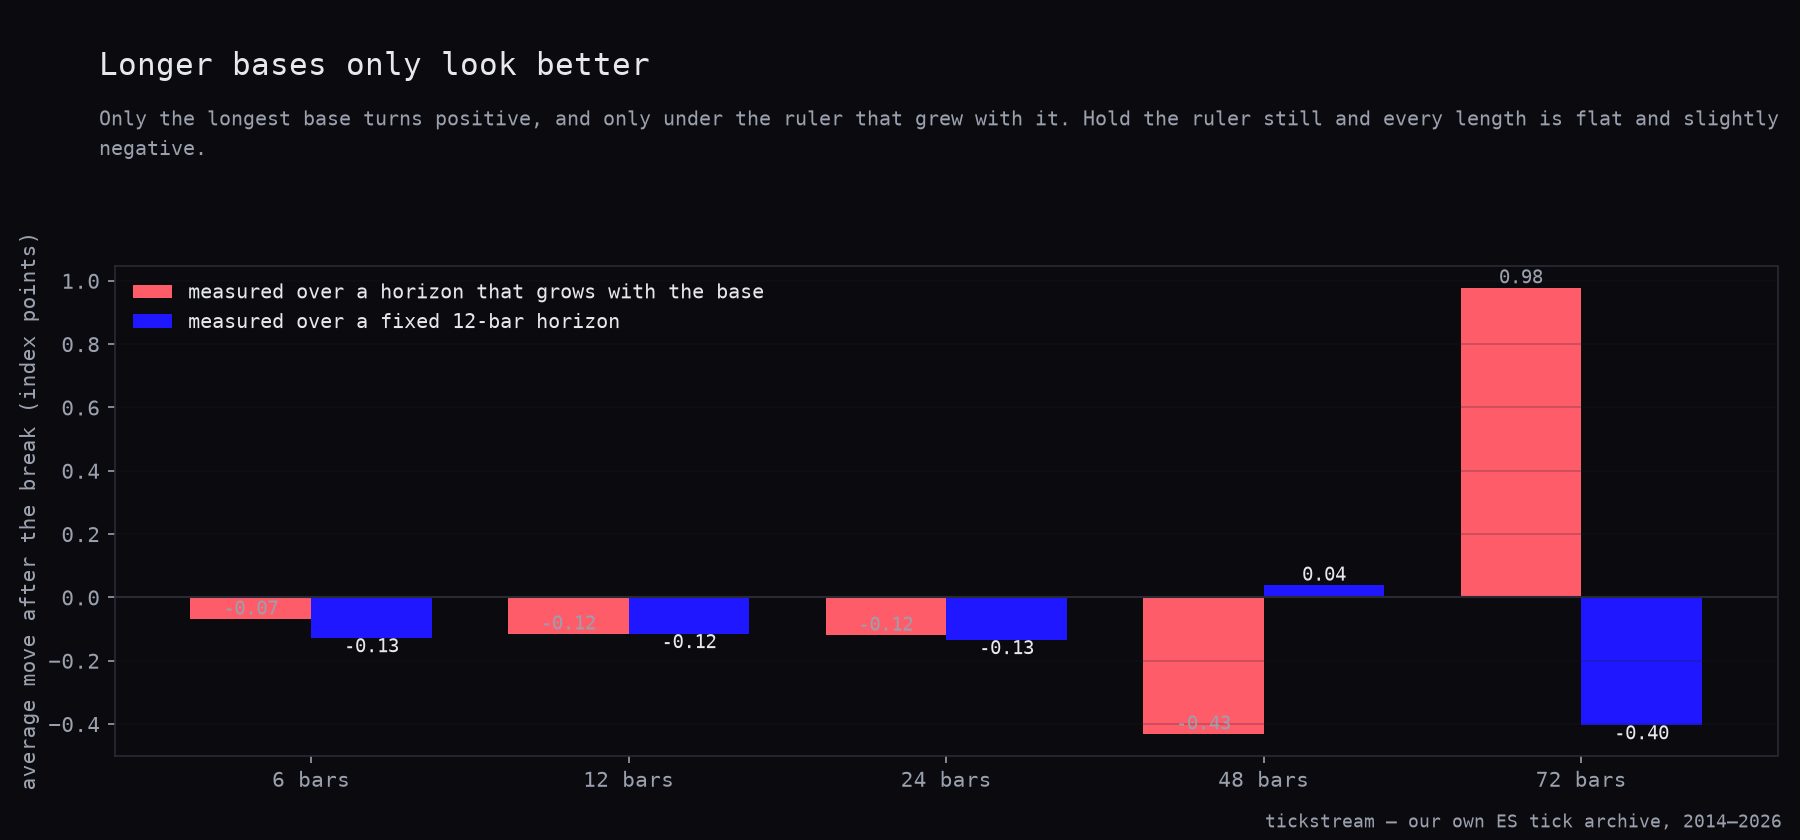
| 72 bars | 3,672 | 17.75 pts | −0.403 pts | +0.978 pts | −1.63 | 1.71 |
The 12-bar row is the control on the method itself: there the two horizons are the same twelve bars, so the two columns agree exactly at −0.115 points. Everywhere else they diverge, and the divergence is the whole claim.
Across all 121,251 breaks, the correlation between base length and move size over the fixed horizon is −0.0006, p = 0.8312. There is nothing there. Over the growing horizon it is +0.0039, p = 0.1720 — still not significant, but positive, and the sign flip is the artefact showing. The 72-bar row is where it is loudest: a 72-bar base gives +0.978 points measured over 72 bars and −0.403 points measured over twelve.
The lead-in for the chart is that pair of bars on the right-hand group. Each base length gets two bars, the red one measured over the growing horizon and the lighter one over the fixed twelve. The red bar only turns positive at 72 bars, and at 48 it is the lowest bar in the chart. Under the fixed ruler every length stays flat and slightly negative.
The mechanism is general and it is not specific to breakouts. A random walk’s expected absolute move grows with roughly the square root of the elapsed horizon. Any measurement whose window scales with the quantity being studied will therefore manufacture a relationship between them, in a series with no relationship in it at all. We ran the same check on Nasdaq futures internally and it died there too, but we never published that one. The ES numbers above are the published version, with five more years of tape under them.
What changes on our side
Nothing goes on the board. NR7 does not beat its own placebo, its premise measures backwards, and the base-length claim survives only under a ruler that grows.
What we keep is the rule. max(level, open) stays mandatory in every breakout test we publish. The twelve-bar row above stays in our template as the sanity check on any horizon-scaled measurement. If the two rulers do not agree where they are the same length, the code is wrong before the finding is even interesting.
Three separate mechanisms in one article produced a result that was not there. An optimistic fill was worth $169,125. A scaling ruler turned −0.403 points into +0.978. Picking the best of six lookbacks moved the per-trade figure from +$50.33 to +$139.11. Each of those is worth more than most real edges, none of them requires bad faith, and all three are easier to write than the honest version.
Method: ES regular-session daily bars (09:30–16:00 New York) and 5-minute bars (09:30–15:55) built from our own tick archive, 2 January 2014 to 10 September 2026, 3,224 sessions. NR(n) is a day whose range equals the minimum of the trailing n. Breakout entries fill at max(level, next bar’s open) for longs and min(level, open) for shorts, never at the level across a gap; the exception is the explicitly labelled level-fill column. Exit is the session close, one contract, no stop. A round trip of $4.50 commission plus two ticks ($29.50 on ES) is charged on every trade. Sharpe is the per-trade series annualised by that variant’s own trade count. The placebo draws 500 sets of random non-NR7 days at the NR7 base rate and applies the identical rule. Base tightness requires the trailing range to be under 0.8 × the 60-bar average range × √L. t-statistics are one-sample against zero, except the next-day range comparison, which is Welch’s two-sample.
Frequently asked questions
Does the NR7 breakout work on S&P 500 futures?
Only barely, and not distinguishably from ordinary days. With honest fills it takes 518 trades at +$116.11 each, +$60,144 over twelve and a half years, t = 2.10 and p = 0.0359. A placebo that breaks the high or low of the same number of ordinary days, NR7 days excluded, pays +$40.94 a trade on average. Of 500 such runs, 9.8% beat the NR7 figure outright.
What is the gap-fill artefact in a breakout backtest?
It is booking the entry at the breakout level even when the next session opened beyond it, which credits the whole overnight gap as profit. On this test it is worth $169,125, or 74% of the $229,269 the optimistic version reports. The honest rule is entry at max(level, next bar's open) for longs and min(level, open) for shorts.
Does a narrow-range day predict a bigger range the next day?
No, it predicts a smaller one. The session after an NR7 day averages 34.95 points of range against 40.31 after all other days, a ratio of 0.867 with t = −3.75. Normalised against each day's trailing twenty-day range the gap widens: 0.854 after NR7 against 1.068 after other days, t = −9.03.
Does a longer consolidation produce a bigger breakout?
Not when the ruler is held still. Across 121,251 breaks of 6 to 72 five-minute bar bases, the correlation between base length and move size over a fixed twelve-bar horizon is −0.0006 with p = 0.8312. Let the measurement horizon grow with the base and the same 72-bar row flips from −0.403 points to +0.978.
Which narrow-range lookback is best on ES?
NR10 has the highest per-trade figure at +$139.11 over 391 trades, t = 2.34. But four of the six lookbacks we ran fail at p = 0.05, NR20 pays +$50.33 a trade with t = 0.71, and the spread from +$50.33 to +$139.11 across a family nobody pre-registered is what a search looks like, not what an edge looks like.