Twelve Rule-Session Cells on ES, Twelve Losses, and the One That Looked Like an Exception
We ran four intraday rules against the Asia, London and New York sessions on 12.5 years of S&P 500 futures — same code, same $29.50 round-trip cost, only the hours change. All twelve cells lose money. The trend pullback was the exception in an earlier version of this article at +$46.90 a trade in New York; that came from a fill-selection bug in our own engine, and corrected it loses $23.99 in New York, $26.58 in London and $23.83 in Asia. Median five-minute volume across those sessions is 11,674, 1,230 and 452 contracts, and the rule loses the same amount in all three — which rules out the liquidity explanation we had reached for.
Every intraday backtest is really a backtest of a session. We ran four rules against the Asia, London and New York sessions on twelve and a half years of S&P 500 futures — same code, same costs, only the hours change.
All twelve cells lose money.
An earlier version of this article reported one exception: a trend pullback paying +$46.90 a trade in New York at t = 13.74, decaying neatly to +$8.16 in London and +$0.28 in Asia, in the same order the sessions rank by volume. It was a tidy story and it was wrong. The number came from a bug in our own fill engine, and the corrected rule loses about $24 a trade in every session.
The correction is more interesting than the result it replaced, because it removes the explanation too.
The rules
ES 5-minute bars, 2 January 2014 to 10 September 2026. Each session is sliced first, then all four rules run on the slice with no cross-session carry.
- Opening range break. First 6 bars of the session set the range; the first break either way is the entry, filled at
max(level, open)for longs andmin(level, open)for shorts. Out at the session’s last close. - Trend pullback. EMA-50 against EMA-200 on the close sets direction. Any bar closing with the trend marks its low (longs) or high (shorts) as a level, set once and never moved. A limit rests there for up to 24 bars. Stop 1× ATR(14), target 2× ATR, out after 48 bars.
- Mean reversion fade. Fade the first touch of 2 standard deviations from the session’s expanding mean. Stop 1.5 standard deviations beyond entry, target the mean.
- First-hour momentum. Direction of the first 12 bars, entry at the 13th bar’s open, out at the session’s last close.
One contract, $4.50 commission plus two ticks of slippage, $29.50 a round trip. A bar containing both stop and target is scored as the stop in every rule.
The grid
| Session | Rule | Trades | Win rate | Per trade | Total | t |
|---|---|---|---|---|---|---|
| New York 09:30–16:00 | Opening range break | 3,209 | 47.8% | −$28.87 | −$92,628 | −1.13 |
| New York 09:30–16:00 | Trend pullback | 21,136 | 34.9% | −$23.99 | −$507,048 | −8.31 |
| New York 09:30–16:00 | Mean reversion fade | 2,913 | 48.5% | −$0.78 | −$2,269 | −0.09 |
| New York 09:30–16:00 | First-hour momentum | 3,215 | 49.4% | −$11.90 | −$38,255 | −0.49 |
| London 03:00–08:00 | Opening range break | 3,195 | 43.4% | −$42.80 | −$136,740 | −3.96 |
| London 03:00–08:00 | Trend pullback | 14,545 | 35.9% | −$26.58 | −$386,576 | −12.59 |
| London 03:00–08:00 | Mean reversion fade | 2,988 | 50.7% | −$5.76 | −$17,205 | −1.32 |
| London 03:00–08:00 | First-hour momentum | 3,205 | 44.0% | −$40.42 | −$129,560 | −3.80 |
| Asia 20:00–03:00 | Opening range break | 3,798 | 46.7% | −$29.52 | −$112,104 | −1.13 |
| Asia 20:00–03:00 | Trend pullback | 19,243 | 37.4% | −$23.83 | −$458,559 | −16.99 |
| Asia 20:00–03:00 | Mean reversion fade | 3,691 | 43.6% | −$22.55 | −$83,222 | −8.16 |
| Asia 20:00–03:00 | First-hour momentum | 3,806 | 45.9% | −$9.79 | −$37,264 | −0.38 |
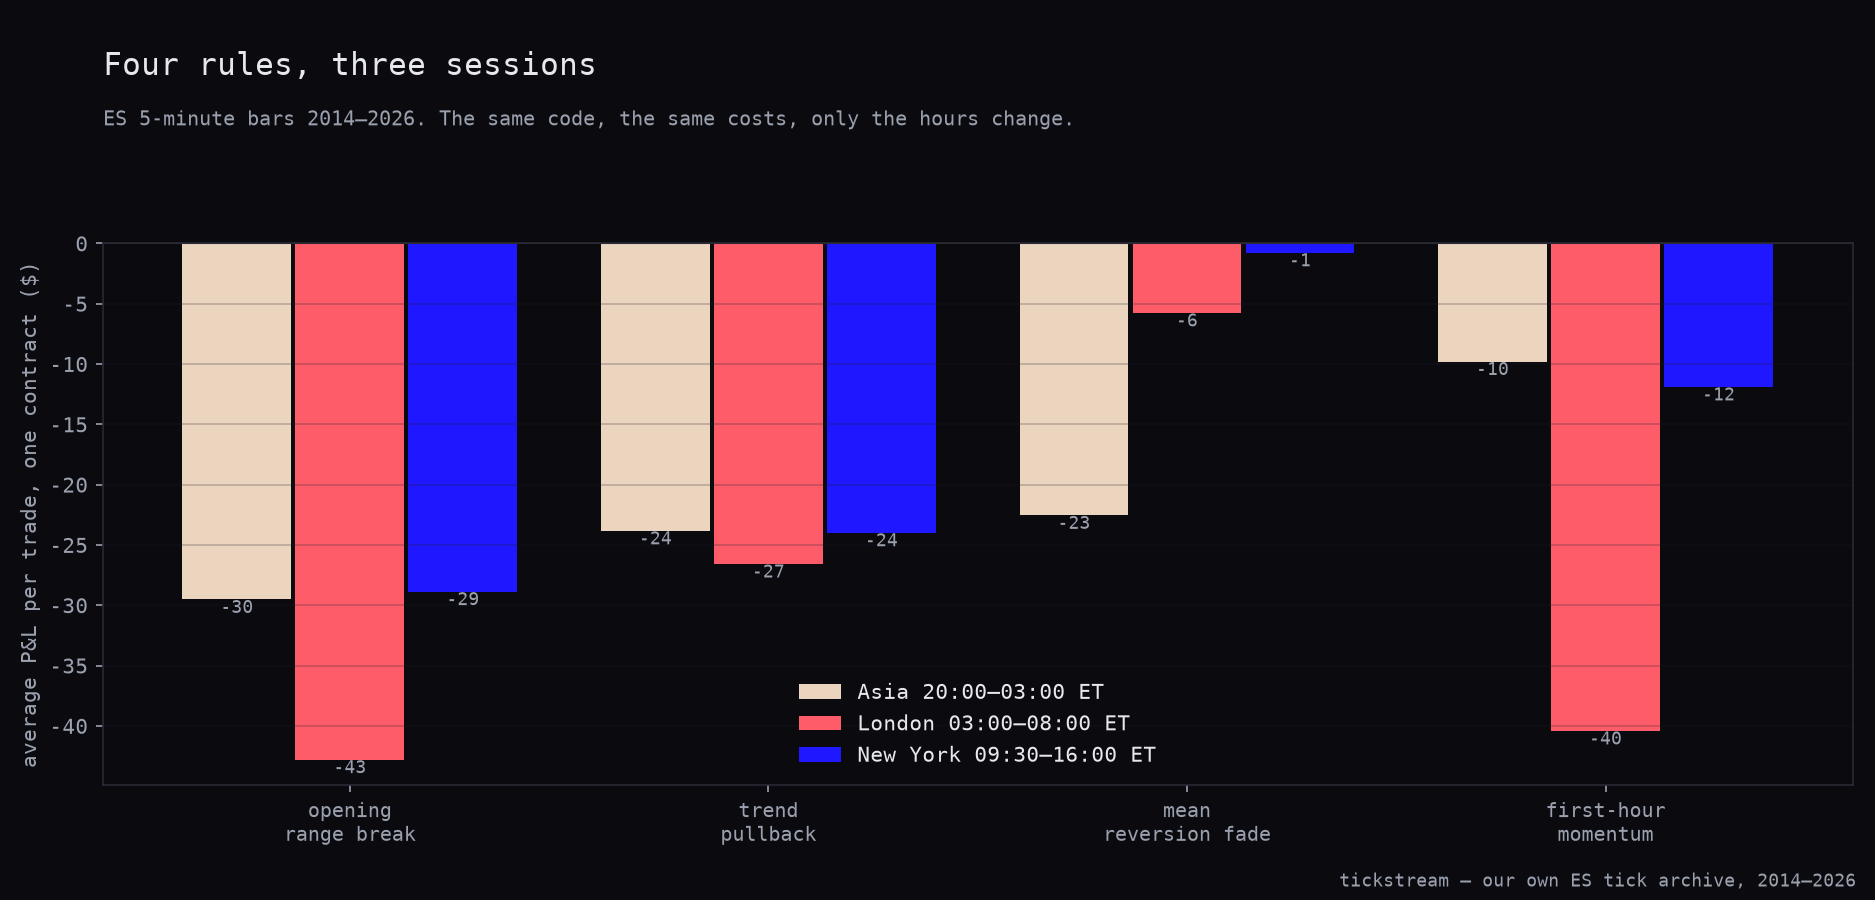
Twelve bars, all below the line. The closest to zero is New York’s mean-reversion fade at −$0.78 a trade, which on 2,913 trades and t = −0.09 is a coin landing on its edge rather than a finding. First-hour momentum in Asia (−$9.79, t = −0.38) and the opening-range break in New York (−$28.87, t = −1.13) are the other two that are not statistically distinguishable from zero, and none of the three is distinguishable from zero in the helpful direction either.
London is the worst session for three of the four rules, and by some distance: −$42.80 on the opening-range break and −$40.42 on first-hour momentum, both significant.
What the correction removed
The original article’s argument was that the trend pullback decayed with session volume. It had the numbers to support it — +$46.90 in New York, +$8.16 in London, +$0.28 in Asia — and the sessions rank by median five-minute volume as 11,674, 1,230 and 452 contracts. Three points in the right order is a persuasive picture, and the mechanism was plausible: a rule that rests a limit needs a counterparty at that limit, and in a 452-contract session there are fewer of them.
Here is the same rule with the fills resolved honestly:
| Session | Median 5-min volume | Per trade |
|---|---|---|
| New York | 11,674 | −$23.99 |
| London | 1,230 | −$26.58 |
| Asia | 452 | −$23.83 |
A 26-fold range in volume, and a $2.75 range in outcome. The rule loses the same amount everywhere, and the thinnest session is not the worst one. Whatever is wrong with the trend pullback has nothing to do with how many contracts trade while it is running.
That is worth stating plainly because the liquidity story was ours and we believed it. It survived because the effect it explained was an artefact, and a good explanation attached to an artefact is harder to dislodge than a bad one — it makes the number feel earned.
The bug, briefly
Every test in this series that rests a limit order scanned each level’s own future to find its fill, then blocked new signals until that trade’s exit:
for i in signals:
    if i <= busy: continue
    for j in range(i + 1, i + 25):     # walk THIS level's future
        if touched(j): take(j); busy = exit_index; break
A level marked at bar 10 and filled at bar 40 sets busy past a level marked at bar 12 that would have filled at bar 15. The run keeps the later fill and discards the earlier one, which is a choice that needs the future. And it is not a random error: levels that take a long time to fill are the ones price travelled far to reach, so the scan systematically kept the deep pullbacks and deleted the shallow ones that get stopped.
The trade counts show it. New York went from 17,160 trades to 21,136; Asia from 15,856 to 19,243. The correction adds trades rather than removing them, and the added ones are the losers.
All fills now come from one shared engine that walks bars forward once, lets levels compete, and gives the book to whichever is touched first.
What this article is still for
The design is the control, and it survives intact. Running identical code and identical costs across three sessions is what isolates the session — there is no separate placebo here because the other two columns are the placebo.
What it was originally used to prove was that the pullback was a cash-session effect. What it proves now is narrower and less comfortable: the session is not the variable. Four rules, three sessions, twelve cells, and the spread between the best and worst session for a given rule never explains the sign. Everything loses in New York too.
We did not run random-entry placebos per cell here. The trend pullback article carries those, and they now lose as well.
Methodology: ES continuous front-month, 5-minute bars resampled from our own trade prints, 2 January 2014 to 10 September 2026. Sessions defined in ET on the bar’s own timestamp: Asia 20:00–03:00 (262,540 bars, 3,877 sessions), London 03:00–08:00 (192,251 bars, 3,239 sessions), New York 09:30–16:00 (247,335 bars, 3,643 sessions); each session sliced first, then all four rules run on the slice with no cross-session carry. Resting limits are resolved chronologically across all live levels, first touch takes the book, ties broken toward the level nearest the bar’s open; the superseded figures quoted here come from the same script before that engine replaced the per-level forward scan. A bar containing both stop and target is scored as the stop in every rule. One contract, $4.50 commission plus two ticks of slippage per round trip, $29.50 on ES. t-statistics are one-sample against zero on per-trade P&L. Median five-minute volume is taken across all bars in each session slice.
Frequently asked questions
Do any intraday rules work outside New York on the S&P?
Not these four, and not in New York either. All twelve of our rule-session cells lose money across twelve and a half years. The closest to zero is the mean-reversion fade in New York at −$0.78 a trade on 2,913 trades, t = −0.09, which is a statistical nothing rather than an edge.
This article originally said the trend pullback paid $46.90 in New York. What changed?
That number came from a bug in our fill engine, which let a slow-filling level retroactively delete a sibling level that would have filled earlier. Corrected, the New York pullback loses $23.99 a trade on 21,136 trades at t = −8.31.
Does session liquidity explain the results?
No, and that is the useful part. Median five-minute volume is 11,674 contracts in New York, 1,230 in London and 452 in Asia — a 26-fold range — and the trend pullback loses $23.99, $26.58 and $23.83 across them. A rule that loses the same in all three is not being killed by thin books.
Which rule is worst, and where?
The opening-range break in London at −$42.80 a trade over 3,195 trades, and first-hour momentum in the same session at −$40.42. London is the worst session for three of the four rules.
What was the control in this test?
The design itself. Running identical code and identical costs across three sessions isolates the session, and the New York column containing four losers is what stops any result reading as a New York effect.