Time-Series Momentum on the S&P Loses to Owning the Index
Nine lookbacks from 5 to 250 days on twelve and a half years of ES, and not one of them clears p = 0.05. The best is the 250-day rule at Sharpe 0.37 with an $82,449 drawdown, against buy and hold's Sharpe 0.70 and $59,950 — and buy and hold is the only result in the study that is statistically significant. We then ran the identical nine-lookback grid on 500 shuffled copies of the same returns: best-of-nine on data with no memory averages Sharpe 0.50, and 75.2% of those noise runs beat our real number.
Nine lookbacks, twelve and a half years of ES, and not one of them clears p = 0.05. The best rule in the grid — long when the trailing 250-day return is positive, short when it is negative — makes $151,025.25 on one contract at Sharpe 0.37. Holding the contract across the same 3,223 sessions makes $288,950 at Sharpe 0.70, and it is the only thing in this study that is statistically significant.
Time-series momentum is the oldest published anomaly in futures, which is exactly why it deserves a harsh test. On our seven years of Nasdaq data it was the second edge that survived, clearing Sharpe 0.6 to 0.8 and halving the drawdown of a long-only book. We never published that NQ run as an article of its own, so there is no companion piece to link here. It appears publicly only as one of five profitable sleeves we used as test subjects in the order-flow filter study, and that study was measuring filters, not the sleeve. On the S&P it does not survive. The way it fails is the more useful half of this article.
The rule
- Daily bars from our own ES tick archive, regular session, New York time. 2 January 2014 to 10 September 2026, 3,224 sessions.
- Take the trailing return over N trading days. Positive means long one contract for the next session, negative means short one.
- Nine values of N: 5, 10, 20, 40, 60, 90, 120, 180, 250. Nothing else is tuned.
- The position changes only when the sign flips. A round trip is charged on every change; holding an existing position costs nothing.
- $4.50 commission plus two ticks per round trip. An ES tick is $12.50, so $29.50 comes out on every flip.
Every lookback, including the ones nobody quotes
| Lookback | Total, one contract | Sharpe | Max drawdown | t | p |
|---|---|---|---|---|---|
| 5 | −$176,284.75 | −0.42 | $201,238.50 | −1.52 | 0.129 |
| 10 | $61,289.25 | 0.15 | $96,453.00 | 0.53 | 0.598 |
| 20 | $13,857.25 | 0.03 | $85,788.50 | 0.12 | 0.905 |
| 40 | $98,239.25 | 0.24 | $81,588.50 | 0.85 | 0.397 |
| 60 | $117,758.25 | 0.28 | $59,172.00 | 1.01 | 0.310 |
| 90 | $109,441.25 | 0.26 | $70,827.00 | 0.94 | 0.3455 |
| 120 | $68,448.25 | 0.17 | $119,017.00 | 0.59 | 0.555 |
| 180 | $92,210.75 | 0.22 | $101,156.00 | 0.80 | 0.426 |
| 250 | $151,025.25 | 0.37 | $82,449.00 | 1.31 | 0.192 |
Nothing in that table is significant. The largest t-statistic in nine tries is 1.31.
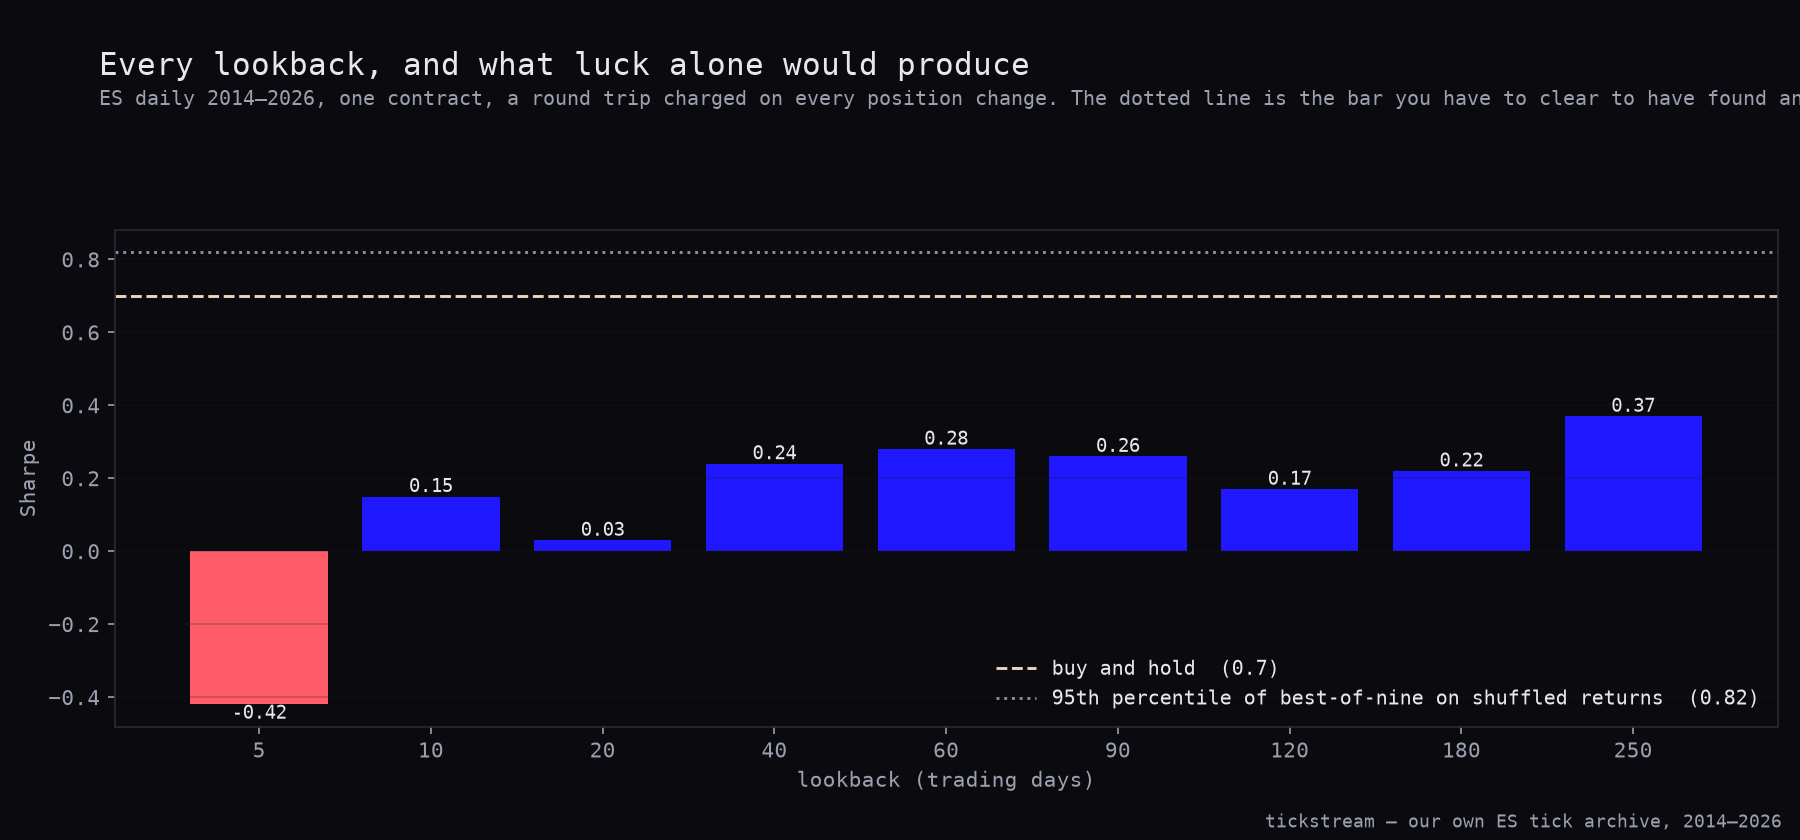
The fast end is not merely weak, it is the wrong sign. The 5-day rule loses $176,284.75 and draws down $201,238.50 — more than the whole grid’s best cell ever makes. Following the last week of direction on the S&P is a losing trade, which is the same thing the RSI-2 result on this archive said from the other side: at short horizons this index reverts. Add a position change on every sign flip at $29.50 a time and you pay for the privilege.
The chart below is the whole surface rather than the winner, with two reference lines drawn across it. The dashed one is buy and hold. The dotted one is the 95th percentile of best-of-nine on returns whose memory has been destroyed, at Sharpe 0.82 — the percentile, not the average of those runs, which is 0.50. Every real bar in the grid sits under both.
The comparison an equity index owes you
There is one baseline a rule on a stock index has to clear before anything else, and it is not zero.
| 250-day momentum | Buy and hold | |
|---|---|---|
| Total, one contract | $151,025.25 | $288,950.00 |
| Average day | $46.86 | $89.65 |
| Sharpe | 0.37 | 0.70 |
| Max drawdown | $82,449.00 | $59,950.00 |
| Days up | 48.6% | 54.3% |
| t | 1.31 | 2.49 |
| p | 0.192 | 0.0129 |
The best momentum rule earns half the Sharpe with a drawdown over a third deeper. One note for anyone reading this next to the overnight study on the same archive. The 0.70 here is computed over the 3,223 sessions this momentum test trades. The 0.65 quoted there is the same $288,950 spread over 3,642 days. Same total, different denominator, and neither number is wrong. Buy and hold is the only column in this study that clears p = 0.05, and it is not a strategy — it is what happens if you do nothing. That is the finding, and it is worth saying without decoration: on the S&P, the twelve-and-a-half-year answer to “should I add a trend filter” is that the filter is subtracting.
Pricing the search
Nine lookbacks is nine chances. Reporting the winner of nine as though it were the only test you ran is the ordinary way a null result gets published as a discovery. It is not usually done dishonestly. The grid gets run, one cell looks good, and that cell gets written up.
So we priced the grid. We rebuilt the ES price path 500 times out of the same daily moves in random order: identical distribution of daily changes, identical volatility, memory destroyed. Then we ran the identical nine-lookback search on each shuffled path and kept only its best cell, which is exactly what we did with the real data.
| Best-of-nine on 500 shuffled paths | Sharpe |
|---|---|
| Mean | 0.50 |
| 95th percentile | 0.82 |
| Maximum | 1.17 |
| Share beating our real best-of-nine (0.37) | 75.2% |
Momentum on ES does worse than the same search run on data with no memory in it at all. Three quarters of the noise runs beat our real result.
The general lesson costs nothing to apply and is worth more than the specific one. Any strategy family with a tunable parameter needs its search priced, and the price is higher than people expect. Nine cells is a small grid by the standards of what gets sold. An entry threshold, an exit, a session filter and a lookback is thousands. Nine cells already sets the bar at 0.82. A Sharpe of 0.37 sounds respectable when it stands alone in a headline. As the winner of nine, it is below average for coin flips.
The variants, all failing the same comparison
The three obvious repairs. Each is built on the 250-day signal, the best cell we have.
| Total | Sharpe | Max drawdown | t | p | |
|---|---|---|---|---|---|
| 250-day, long and short | $151,025.25 | 0.37 | $82,449.00 | 1.31 | 0.192 |
| Long only | $214,051.25 | 0.60 | $57,287.50 | 2.14 | 0.033 |
| Volatility targeted | $194,778.54 | 0.45 | $67,389.47 | 1.59 | 0.111 |
| Half buy and hold, half momentum | $219,987.62 | 0.61 | $57,287.50 | 2.19 | 0.028 |
| Buy and hold | $288,950.00 | 0.70 | $59,950.00 | 2.49 | 0.0129 |
Dropping the short side takes the Sharpe from 0.37 to 0.60 and produces a significant t of 2.14. That looks like the repair working, and it is not. Long-only 250-day momentum is significant because it is a worse version of buy and hold. It is long most of the time and flat the rest, so its P&L is the index minus the days it sat out. Its share of up days falls to 41.7% against buy and hold’s 54.3%, which is what flat days look like when they count as neither. Removing exposure from a rising index removes return.
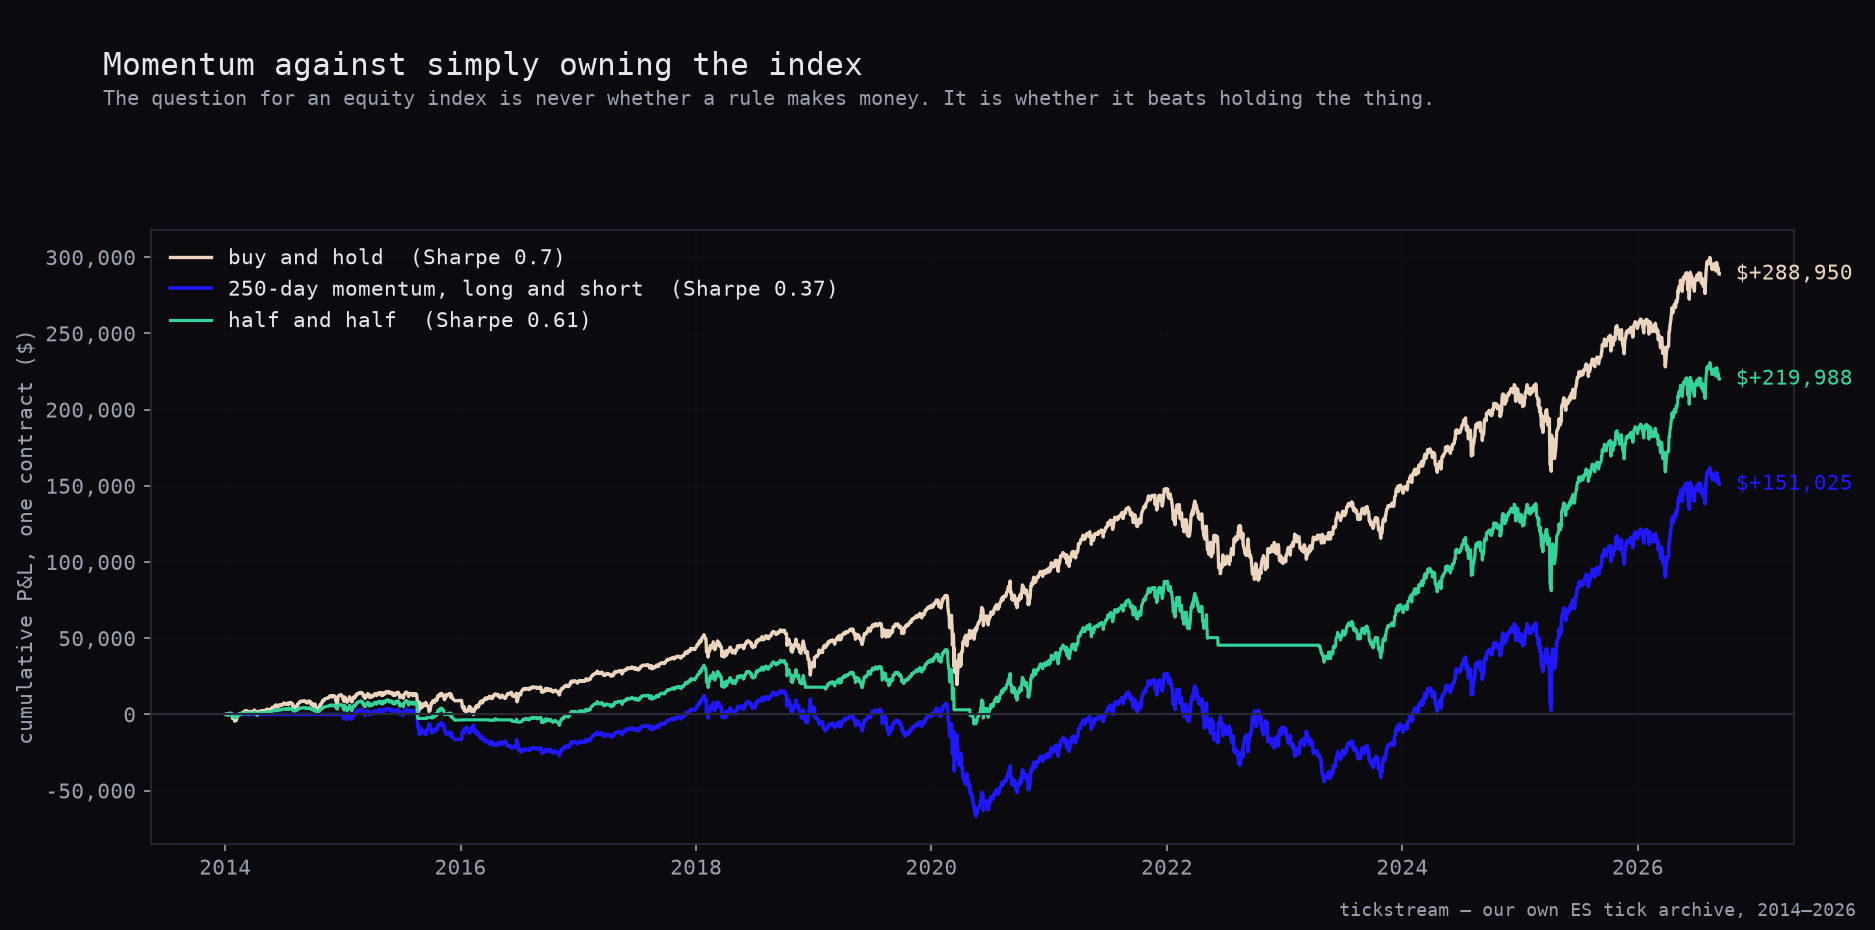
The blend is the clearest number in the section. Mixing momentum half-and-half into buy and hold takes the Sharpe from 0.70 down to 0.61. On NQ this same blend halved the drawdown, which was the reason we ran it. Here it does not even hold the Sharpe, and its drawdown of $57,287.50 against buy and hold’s $59,950 is not enough protection to pay for the return it gives up.
Three equity curves, one contract, costs in. Buy and hold on top for the entire twelve and a half years, the blend beneath it, momentum at the bottom. Note where the blue line spends 2015 to 2018, and note that its deepest hole is the 2020 crash — the event a trend filter is supposed to be insurance against.
A split that looks like validation and is not
| Days | Total | Sharpe | Max drawdown | t | p | |
|---|---|---|---|---|---|---|
| Train 2014–2020 | 1,762 | −$27,911.75 | −0.17 | $82,449.00 | −0.46 | 0.646 |
| Holdout 2021–2026 | 1,461 | $178,937.00 | 0.76 | $70,857.50 | 1.82 | 0.069 |
Read carelessly, that is the best-looking table in the article: the rule was flat-to-negative in the first seven years and made $178,937 at Sharpe 0.76 in the last five. Read properly, it is a warning.
A losing train and a winning holdout is not out-of-sample validation. It is a regime change with a hopeful label attached. Out-of-sample confirmation means a result found in the first half survives into the second. There was no result in the first half to survive — the train period loses money at Sharpe −0.17. What the split actually shows is that all of this rule’s performance comes from one recent stretch, which is the definition of a sample you cannot lean on. The holdout does not reach p = 0.05 either.
Note which half fails. Our NQ archive starts in 2019, so nearly the whole of that losing 1,762-day train period is window the Nasdaq test could never have seen. This is the reason the series exists: the extra five years of ES are where a rule gets to be wrong for long enough to notice.
Year by year
| Year | 250-day momentum | Buy and hold |
|---|---|---|
| 2014 | $0.00 | $11,225.00 |
| 2015 | −$16,516.75 | −$2,300.00 |
| 2016 | −$2,071.00 | $12,375.00 |
| 2017 | $22,175.00 | $22,175.00 |
| 2018 | −$2,076.00 | −$9,237.50 |
| 2019 | −$1,049.50 | $37,375.00 |
| 2020 | −$28,373.50 | $21,787.50 |
| 2021 | $54,625.00 | $54,625.00 |
| 2022 | −$36,822.50 | −$47,100.00 |
| 2023 | $1,356.00 | $47,187.50 |
| 2024 | $56,437.50 | $56,437.50 |
| 2025 | $68,091.00 | $49,150.00 |
| 2026 | $35,250.00 | $35,250.00 |
The honest nuance first. In 2022, the one badly down year in the sample, momentum lost $36,822.50 where buy and hold lost $47,100. The trend filter did cushion the drawdown, which is the thing it is sold to do, and 2018 and 2025 also came in ahead. But 2020 is what a whipsaw costs: −$28,373.50 against buy and hold’s +$21,787.50. A rule that needs a year of history to change its mind is late to a crash and late to the recovery, and 2020 charged it for both.
Four of the thirteen years are identical in both columns — 2017, 2021, 2024 and 2026. That is not a coincidence and it is the mechanical reason this family cannot add much to an equity index. A 250-day filter on a market that spends most of its time above where it was a year ago is simply long the whole year. Most of the time, the rule is the index. The years where it differs are the years it is short, and on a structurally rising index those are the years it pays for.
One more note on the table: 2014 shows exactly zero because a 250-day lookback needs a year of history before it can take a position at all.
What we changed
Nothing in the live book, because we have never traded a trend filter on ES. Two things changed in how we test.
- Every parameter grid in this series now ships with a shuffled best-of-N control. The 0.37 would have gone into an internal note as “weakly positive, worth watching” a year ago. It is below the noise floor of its own search, and we only know that because we measured the noise floor.
- The NQ verdict gets a border drawn around it. Time-series momentum earned its place in our NQ book on seven years of one index. It does not port to the S&P over twelve and a half, so it stays an NQ sleeve and does not become a house rule.
The archive this ran on is for sale: ES ticks back to 2014 with the real aggressor side on every print, in the historical data packages.
Methodology: ES regular-session daily bars (09:30–16:00 New York) built from our own tick archive, 2 January 2014 to 10 September 2026, 3,224 sessions, 3,223 tradeable. Signal is the sign of the trailing N-day close-to-close change, applied to the next session, one contract, no stop. A round trip of $4.50 commission plus two ticks ($29.50 on ES) is charged on every position change; holding is free. Sharpe is on the daily P&L series, annualised by √252. t-statistics test the daily series against zero. The volatility-targeted variant scales position by 15% annualised target over 20-day realised volatility, clipped to 0.2–3.0×. The shuffle control draws 500 random permutations of the daily close-to-close changes, rebuilds the price path from each, and re-runs all nine lookbacks, keeping each path’s best Sharpe.
Frequently asked questions
Does time-series momentum work on ES?
Not at any of the nine lookbacks we tested. The best cell in the grid is the 250-day rule at Sharpe 0.37, $151,025.25 on one contract over 3,223 sessions, with t = 1.31 and p = 0.19. The worst is the 5-day rule at Sharpe −0.42 and −$176,284.75. Not one of the nine reaches p = 0.05.
Why run the same test on shuffled returns?
Because nine lookbacks is nine chances to get lucky, and the winner of nine has to be priced as the winner of nine. We rebuilt the ES price path 500 times from the same daily moves in random order, so the distribution is identical and the memory is gone, then ran the whole grid on each. Best-of-nine on that memoryless data averages Sharpe 0.50, hits 0.82 at the 95th percentile and 1.17 at its maximum. Our real 0.37 is beaten by 75.2% of them.
How does momentum compare to simply holding the contract?
It loses on both axes. Buy and hold returns $288,950 at Sharpe 0.70 with a $59,950 maximum drawdown, t = 2.49, p = 0.0129. The best momentum rule returns $151,025.25 at Sharpe 0.37 and draws down $82,449. Buy and hold is the only result in this entire test that separates from zero.
The long-only version is significant. Isn't that an edge?
It is significant and it is still worse than the thing it is built on. Long-only 250-day momentum makes $214,051.25 at Sharpe 0.60, t = 2.14, p = 0.033 — below buy and hold's 0.70 on the same window. It is long most of the time and flat for the rest, so what it does is sit out some of the index's good days. Blending it half-and-half with buy and hold gives Sharpe 0.61, which is also below 0.70.
Did momentum at least cushion the bad year?
In 2022 it did. The 250-day rule lost $36,822.50 while buy and hold lost $47,100, so the trend filter was worth something in the one badly down year of the sample. It cost more than that in 2020, where it was whipsawed for −$28,373.50 while buy and hold made $21,787.50, and in 2023, where it made $1,356 against $47,187.50.