The 86% Win Rate That Still Loses Money: We Backtested the Negative-RR VWAP Absorption Strategy on 7 Years of NQ
A reader sent us a prop-firm strategy: fade the first VWAP touch of the RTH session, confirm with absorption, take $250, risk $2,000. It wins 86% of the time — and needs 89.3% to break even. We spent the whole study hunting those missing 3.4 points across 24 signal variants and 36 bracket combinations. Every one fell short by the same amount, and a random entry beat the strategy in 17 of 20 runs.
A reader sent us a strategy with an unusually honest label on it: “purely designed for prop firm milking.” The idea is the negative risk-reward trade that circulates in every prop-firm Discord — win small, win often, and hope the rare big loss stays rare.
The rules are specific, which is what makes it testable:
- one trade per day, RTH session only
- enter on the first time price touches VWAP during RTH
- confirm with absorption: a 1-minute and 5-minute candle closing back through the level, below the big trades
- take profit $250, stop loss $2,000
- stay inside 50k-account parameters — never risk more than $2,000
We ran it on 1,853 trades of real NQ minute data from March 2019 to August 2026. It won 85.7% of them. And it lost $60,664.
The number that decides this before the data does
Before running anything, one line of arithmetic tells you what the strategy has to achieve.
If you risk $2,000 to make $250, you need your wins to cover your losses:
250 × w  −  2000 × (1 − w)  =  0
                        w  =  2000 / 2250  =  88.9%
Add real costs — $4.50 commission and a quarter-point of slippage each way, $14.50 a round trip — and the bar moves to 89.3%.
That is the whole study in one number. The question was never “is this profitable?” It was “can absorption at VWAP be right 89.3% of the time?” A negative-RR system has no room to be approximately right. At 89.3% you break even. At 85.7% you lose sixty thousand dollars.
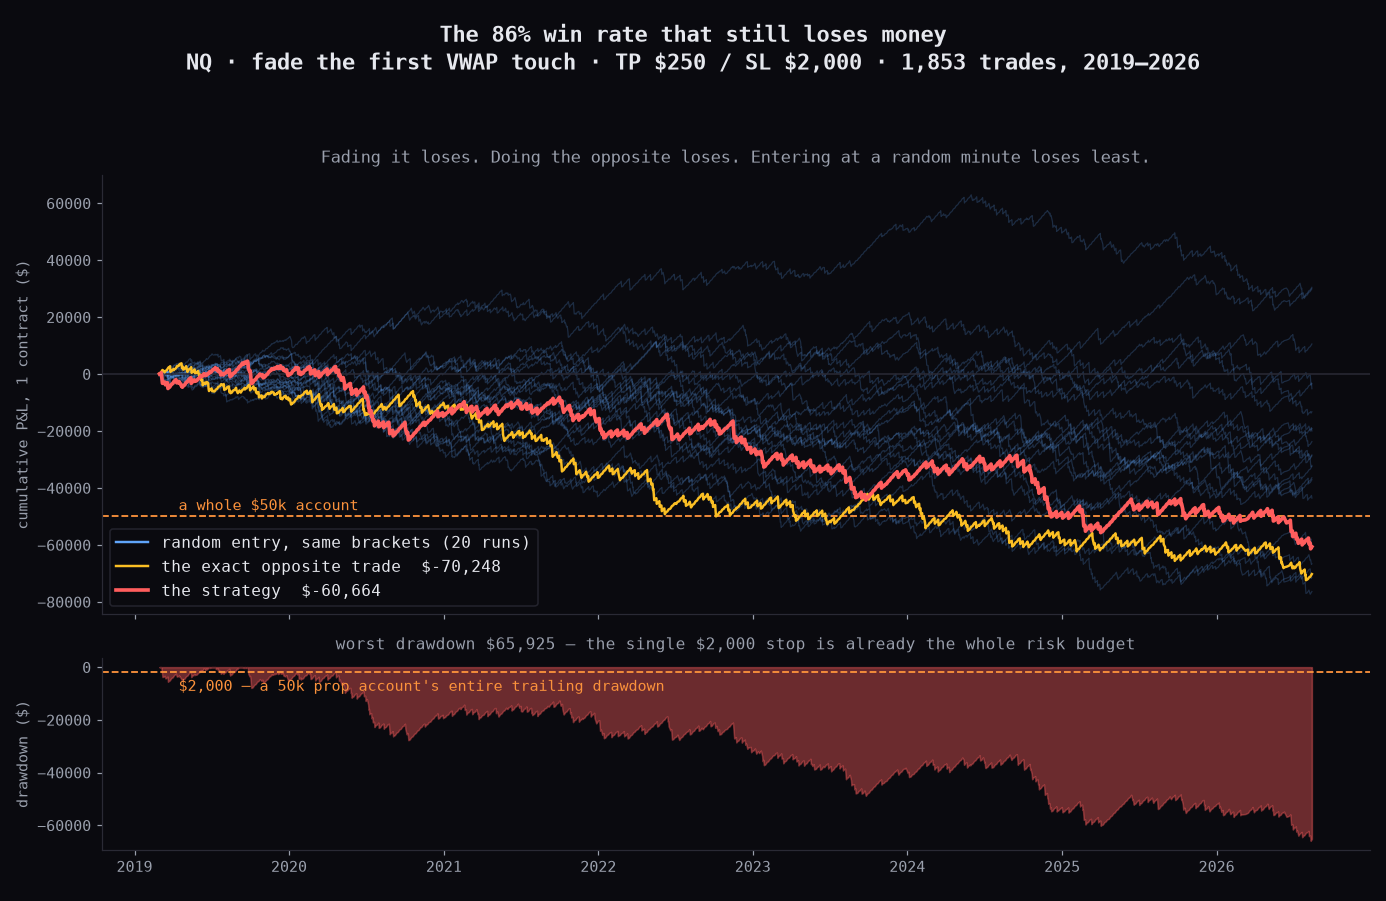
The equity curve is the shape everyone who trades this eventually meets: long quiet stretches of small green, punctuated by cliffs. Seven of the eight years lost money. The one exception, 2025, made $1,026 — at a 89.3% win rate, which is to say it landed exactly on break-even and the profit is rounding.
| Year | Trades | Win rate | P&L |
|---|---|---|---|
| 2019 | 206 | 77.2% | −$302 |
| 2020 | 252 | 84.9% | −$14,299 |
| 2021 | 254 | 87.4% | −$1,253 |
| 2022 | 244 | 86.9% | −$11,423 |
| 2023 | 247 | 87.4% | −$6,372 |
| 2024 | 255 | 85.5% | −$14,943 |
| 2025 | 253 | 89.3% | +$1,027 |
| 2026 | 142 | 85.2% | −$13,099 |
Then we went looking for the missing 3.4 points
This is where most of the work went, and it is the part worth reading. Being 3.4 percentage points from break-even does not feel far. It feels like a tuning problem — one more filter, one better session, one smarter bracket. So we tried to close it, deliberately and exhaustively.
Attempt 1: make the absorption stricter. The submitted rule says the confirming candle should close below the big trades. We built that six ways: average trade size at the touch above the median, above the 75th percentile, above the 90th percentile, delta agreeing with the trade direction, and the strict filters combined with delta. The logic is sound — if a big seller is absorbing buyers at VWAP, that should be the highest-quality version of the signal.
It went the wrong way. Every absorption filter lowered the win rate.
| Confirmation | Trades | Win rate |
|---|---|---|
| none (raw first touch) | 1,853 | 85.7% |
| big trade > median | 1,756 | 84.6% |
| big trade > 75th pct | 1,533 | 83.4% |
| big trade > 90th pct | 1,047 | 84.0% |
| delta agrees | 1,847 | 85.5% |
| big trade 75th + delta | 1,422 | 83.3% |
On the 5-minute confirmation the strictest filter fell from 85.6% to 81.3%. Selecting for the biggest prints at the level selected for the trades most likely to run you over — which is what you would expect if the “absorption” is not absorption at all, but simply the arrival of size that then keeps going.
This is the same result we got when we tested order flow as a filter on strategies that already work: 22 of 25 combinations got worse. A confirmation rule can only ever remove trades. For that to help, it has to remove the bad ones, and coincident tape information does not know which those are.
Attempt 2: change the VWAP and the timeframe. The reader suggested testing both ETH and RTH VWAP, “maybe there is some variance.” There is, and it points the wrong way: ETH VWAP was consistently worse (83.7% vs 85.7% on the 1-minute confirmation). Across all four combinations of session anchor and confirmation timeframe, not one of the 24 variants reached 89.3%. The best of them was the plainest: raw RTH first touch, no absorption filter at all.
Attempt 3: move the brackets. If the win rate will not rise to meet the bracket, move the bracket to meet the win rate. We swept 36 combinations — stops from $500 to $2,000, targets from $100 to $1,000, everything inside the 50k risk cap.
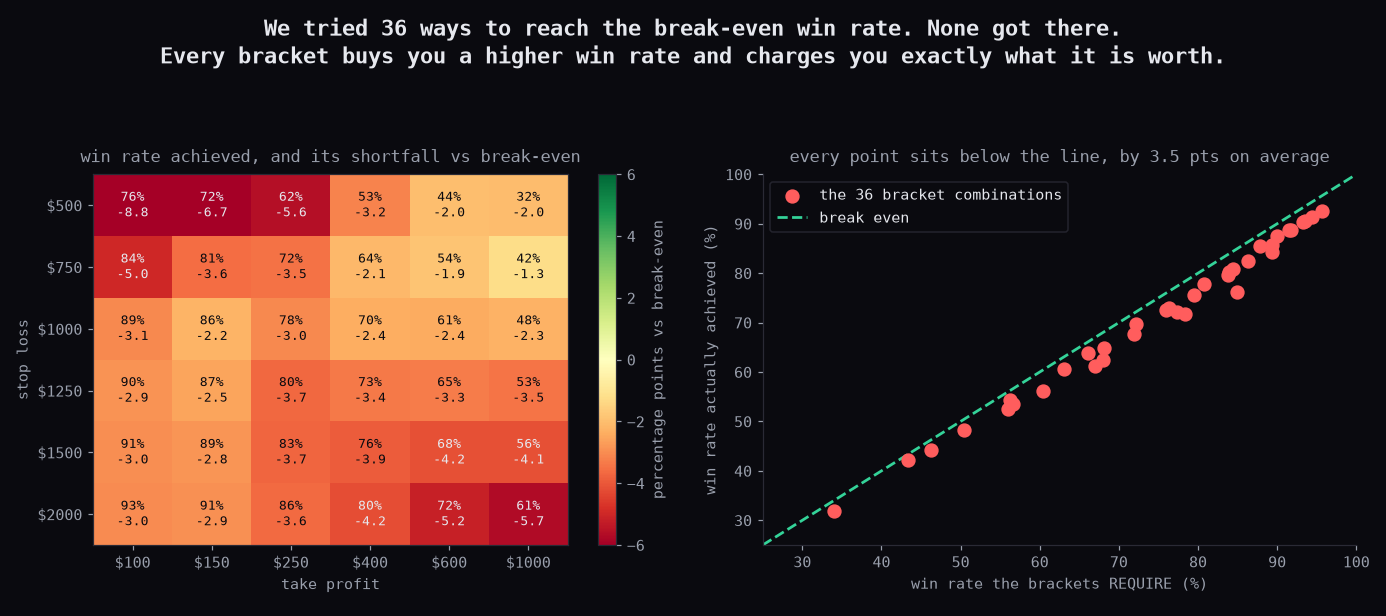
All 36 lost. And the pattern in that grid is the actual finding of this study. Widening the stop does raise the win rate exactly as advertised — $500 stops win 76%, $2,000 stops win 93%. But every point sits below the break-even line it needs to clear, by 3.5 percentage points on average, and the gap barely moves as you travel around the grid.
That is the signature of a signal with no edge. The bracket manufactures the win rate; it does not manufacture profit. You are choosing what your losses look like — many small ones or a few enormous ones — not whether you have them.
Three controls, and the strategy failed all three
A losing backtest is only worth publishing if you have checked that the loss means something. So:
Control 1 — take the opposite trade. If fading the VWAP touch loses reliably, then trading with it should win. It doesn’t: the exact opposite trade lost $70,248, slightly worse. Both directions losing is the fingerprint of costs eating a coin flip, not of a signal pointing backwards.
Control 2 — enter at a random minute. Same brackets, same one-trade-a-day, same session — but entered at a randomly chosen RTH minute in a randomly chosen direction. Twenty runs averaged −$26,328, and won 81.7% of the time purely from the bracket geometry. The random entry beat the strategy in 17 of 20 runs.
Control 3 — does the level do anything at all? Between the two above, the answer is no. Everything the strategy produces — the high win rate, the shape of the curve, the loss — is reproduced by ignoring VWAP entirely and clicking at an arbitrary moment. The VWAP touch, the absorption, the 1-minute and 5-minute confirmation: none of it adds anything a coin flip does not already deliver.
The prop-firm part, which is worse than the backtest
Set the edge aside. The strategy cannot be run as written on the account it was designed for.
A typical 50k evaluation account carries a trailing drawdown around $2,000–2,500 and a daily loss limit near $1,000. The strategy’s stop is $2,000. That single stop is the entire trailing drawdown, and twice the daily loss limit — so the first losing trade does not dent the account, it ends it.
There were 210 of those stops across the test. The worst drawdown was $65,925, about 1.3 whole accounts. The strategy’s own risk parameter is larger than the risk budget of the account it targets, which means the 86% win rate never gets the chance to matter. You are not milking the prop firm. You are buying a lottery ticket where the prize is passing an evaluation and the price is the evaluation fee.
Why this shape is so seductive
Negative-RR systems feel like discovering a cheat code, and the reason is psychological rather than mathematical. You win four days in a row. Then five. The account creeps up. Every winning trade confirms the method, and the losses are rare enough to feel like bad luck rather than the bill arriving.
But the win rate was never evidence. On NQ, a coin flip with a $250 target and a $2,000 stop wins about 82% of the time. Almost the entire 85.7% the strategy achieved is available for free, with no rules at all. The strategy’s contribution over random noise is under four percentage points, and it needs seven.
The honest way to evaluate any high-win-rate method is to ask what a random entry with the same brackets would have done. If you cannot beat that, the win rate is coming from your exits, and your exits are not an edge — they are a choice about the shape of your losses.
The bottom line
Fading the first VWAP touch of the RTH session with absorption confirmation wins 85.7% of the time and needs 89.3%. We tried 24 signal variants and 36 bracket combinations to find the missing points; none of them got there, absorption filters made it worse rather than better, and the plainest version of the rule was the best one. The opposite trade loses, a random entry loses less, and the $2,000 stop is larger than the entire drawdown allowance of the 50k account the strategy was built for.
If you are testing a negative-RR system of your own, run the random-entry control first. It takes ten minutes and it will tell you what fraction of your win rate you actually earned.
Methodology: NQ continuous front-month, 1-minute bars built from real trade prints, 2019-03-01 to 2026-08-14, 2,275 sessions, 1,853 trades. RTH 09:30–16:00 ET with true New York wall-clock (DST-aware), VWAP accumulated from the RTH open or the 18:00 ET ETH open. Entry at the close of the confirming bar; entry and target never resolve in the same bar; when a bar spans both stop and target the stop is taken. Costs $4.50 commission per round trip plus 0.25 points slippage per side, $20 point value. Absorption proxied by average trade size (volume ÷ print count) at the confirming bar, since a block shows up as volume concentrated in few prints. Placebo: 20 runs of one random RTH minute per day with a random direction and identical brackets.
Frequently asked questions
Can a negative risk-reward strategy be profitable?
Only if the win rate clears the break-even the payoff ratio demands, and that bar rises fast. Risking $2,000 to make $250 needs 88.9% of trades to win before costs and 89.3% after them. That is not impossible in principle — but it means your signal must be right nine times out of ten, and every backtest we have run on this shape lands a few points short. In this study the strategy won 85.7% of 1,853 trades, which sounds excellent and loses $60,664.
Does fading the first VWAP touch of the session work on NQ?
No. Over 1,853 trades from 2019 to 2026 it lost money in seven of eight years, and it failed three separate controls: taking the exact opposite trade also lost (−$70,248), a random entry at a random RTH minute with the same brackets lost less (−$26,328 average), and the random entry beat the strategy in 17 of 20 runs. The first VWAP touch is not a level with an edge, it is just a place where price happens to be.
Does adding absorption confirmation improve a VWAP fade?
It made it worse in our tests. We tried six confirmation rules — large average trade size at the touch, volume above the median, above the 75th and 90th percentiles, delta agreement, and combinations — across both RTH and ETH VWAP and both 1-minute and 5-minute closes. Not one of the 24 variants reached the 89.3% break-even win rate, and the stricter the absorption filter, the lower the win rate: the tightest big-trade filter dropped it from 85.6% to 81.3%. This matches what we found testing order flow as a filter on strategies that already work, where 22 of 25 combinations got worse.
Why do high win-rate strategies feel so profitable when they are not?
Because the win rate is set by the exit geometry, not by the signal. Put the target close and the stop far away and you will win most trades no matter what you enter on — a coin flip with a $250 target and a $2,000 stop wins about 82% of the time on NQ. The feeling of being right nine times out of ten is manufactured by the bracket, and it costs exactly what it is worth. In our 36-combination grid, every single bracket landed below its own break-even line, by 3.5 percentage points on average.
Is a $2,000 stop viable on a 50k prop account?
Not on most of them. A typical 50k evaluation account carries a trailing drawdown around $2,000–2,500 and a daily loss limit near $1,000. A single $2,000 stop is therefore the entire risk budget, or more than it — one losing trade ends the account before the strategy's win rate ever gets a chance to express itself. The backtest's worst drawdown was $65,925, roughly 1.3 whole accounts.