The Order-Flow Confirmation Makes the VWAP Fade Worse on ES, in All Four Bands
We faded the session VWAP sigma bands on 12.5 years of S&P 500 futures, then re-scored the identical signals with the cumulative-delta confirmation the tutorials bolt on. The filter cost money at every width: −$9.75, −$1.79, −$3.52 and −$16.76 a trade, helping in 0 of 4 bands. It is worst where it discards the most, cutting the 3.0σ band from 1,718 trades to 912 at a cost of $16.76 each. The first-touch VWAP scalp lost $31.18 a trade over 3,131 trades while winning 52.4% of them.
Fading the VWAP standard-deviation bands loses money on the S&P 500 in every configuration we tested. That is the expected result and not the story. The story is the cumulative-delta confirmation that every tutorial bolts on to fix it: on the same signals, on the same bars, it made the strategy worse at all four band widths.
We can measure that directly, which is why the test exists. Run the signals, score them twice, once alone and once requiring the session’s cumulative delta to disagree with the excursion. The difference between those two columns is exactly what the confirmation is worth. It came to −$9.75, −$1.79, −$3.52 and −$16.76 a trade, and it helped in 0 of 4 bands.
The rule
- ES 1-minute bars inside the cash session, 1,233,006 of them across 3,643 sessions, 2 January 2014 to 10 September 2026.
- Session VWAP rebuilt at each cash open, with a running volume-weighted standard deviation on the same clock. Nothing carries over from the previous day.
- Signal when a bar’s high reaches VWAP + k·σ (short) or its low reaches VWAP − k·σ (long).
- Entry at the band, target the session VWAP, stop three quarters of a band beyond the entry. Out after 60 bars either way.
- At most one trade a session. The first qualifying band touch is the trade; the rest of the day is ignored.
- Four widths: k = 1.5, 2.0, 2.5, 3.0.
- The confirmation, when on, adds one condition: the session’s cumulative delta must disagree with the excursion. A push to the upper band is only shorted if cumulative delta is not positive.
Costs are $4.50 commission plus two ticks of slippage per round trip. An ES tick is $12.50, so $29.50 comes off every trade in every number below.
The confirmation rule is the only difference between the two arms. Same bars, same VWAP, same bands, same bracket, same one-trade-a-day cap. That makes the unfiltered arm the control for the filtered one, which is the comparison the tutorials never run.
Eight configurations, eight losses
The equity curves for the four unfiltered widths sit below. What to look at is the ordering: the tighter the band, the steeper the decline, and none of the four ends above zero. The 3.0σ line is the flat one, and it is flat in the way a fairly priced bet is flat.
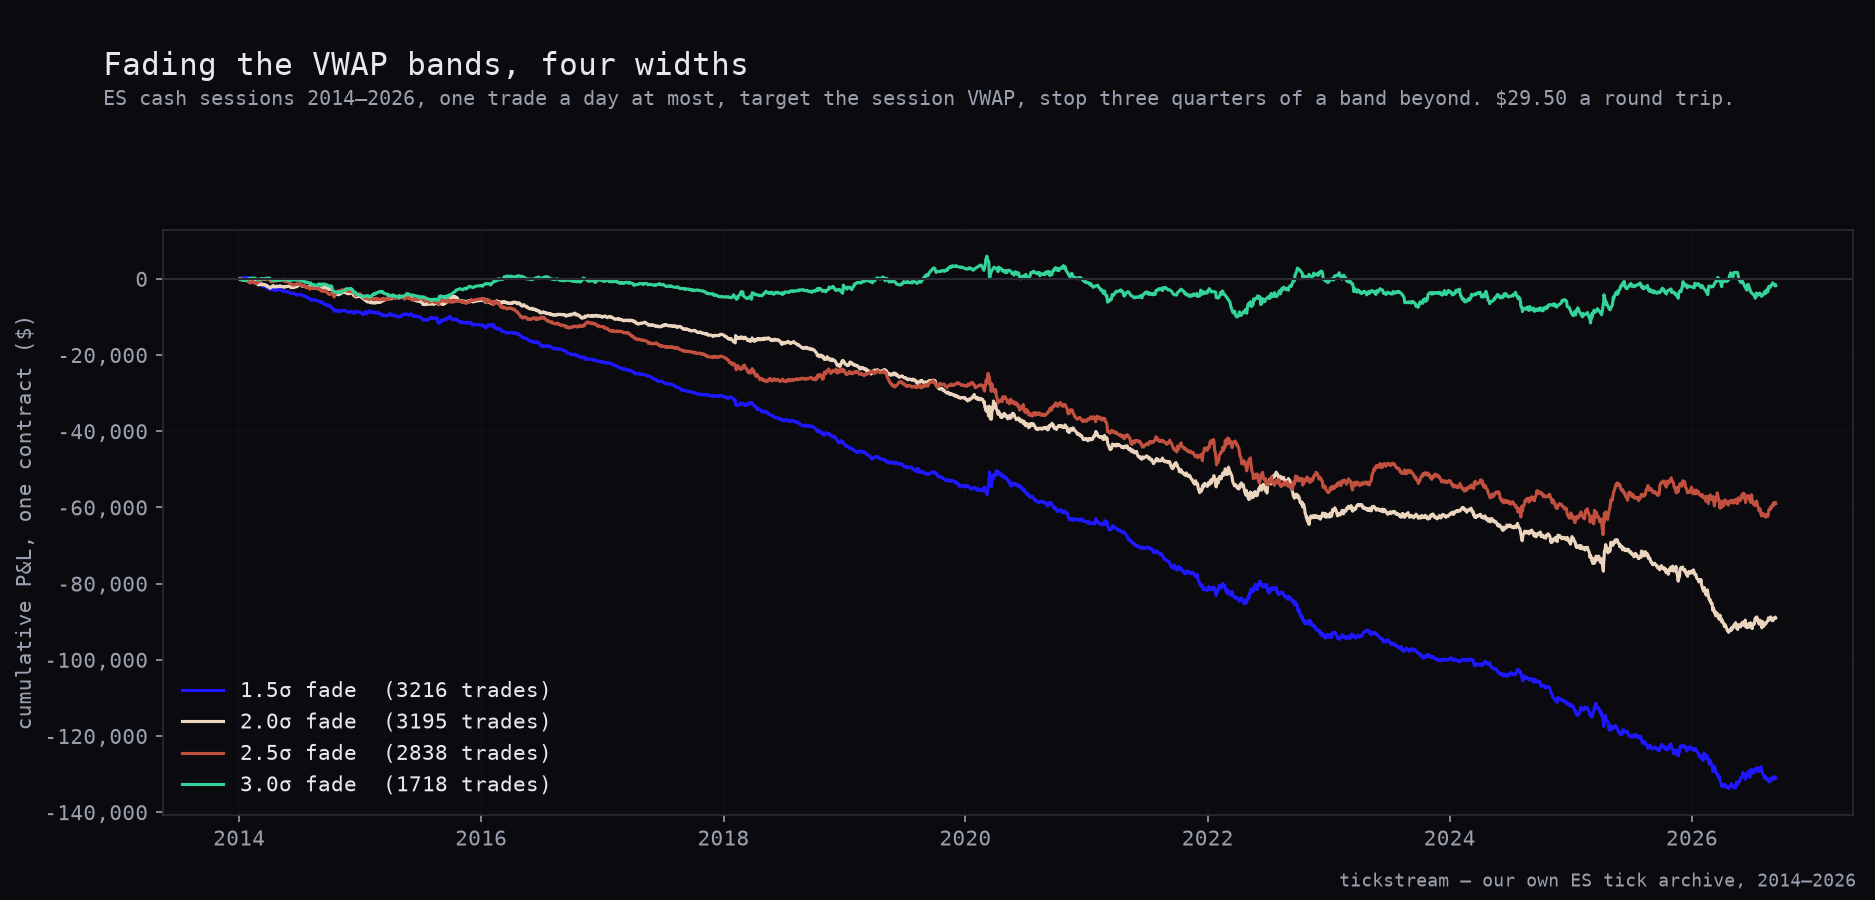
Here is the full grid.
| Band | Arm | Trades | Win rate | Avg per trade | Total | PF | Sharpe | t | p |
|---|---|---|---|---|---|---|---|---|---|
| 1.5σ | signal alone | 3,216 | 40.5% | −$40.75 | −$131,044.86 | 0.643 | −2.62 | −9.33 | 0.0000 |
| 1.5σ | delta confirmed | 2,987 | 41.1% | −$50.50 | −$150,856.37 | 0.618 | −2.71 | −9.65 | 0.0000 |
| 2.0σ | signal alone | 3,195 | 45.1% | −$27.87 | −$89,032.13 | 0.791 | −1.37 | −4.89 | 0.0000 |
| 2.0σ | delta confirmed | 2,657 | 45.0% | −$29.66 | −$78,803.78 | 0.796 | −1.19 | −4.23 | 0.0000 |
| 2.5σ | signal alone | 2,838 | 45.4% | −$20.78 | −$58,965.69 | 0.861 | −0.81 | −2.89 | 0.0039 |
| 2.5σ | delta confirmed | 1,896 | 45.4% | −$24.30 | −$46,067.32 | 0.845 | −0.72 | −2.57 | 0.0102 |
| 3.0σ | signal alone | 1,718 | 49.2% | −$1.05 | −$1,800.93 | 0.993 | −0.03 | −0.10 | 0.9168 |
| 3.0σ | delta confirmed | 912 | 46.8% | −$17.81 | −$16,245.83 | 0.890 | −0.34 | −1.22 | 0.2239 |
Two of the confirmed rows have a smaller total loss than their control. That is a trade-count effect and not an improvement. The 2.0σ filtered arm loses $78,803.78 against $89,032.13 because it takes 2,657 trades instead of 3,195, while its per-trade result is worse. Per trade is the only fair comparison when a rule’s whole job is to remove trades.
The 3.0σ unfiltered row is the one worth sitting with. It loses $1.05 a trade over 1,718 trades, t = −0.10, p = 0.9168, profit factor 0.993. Nothing is there. A three-sigma excursion in the S&P reverts often enough to pay for the round trip and not a cent more. That is what a correctly priced market looks like from the inside, and it is the honest baseline against which the other three widths are simply paying more in costs and adverse selection.
What the confirmation is worth
This is the section the article is for. The chart puts the two arms side by side at each width.
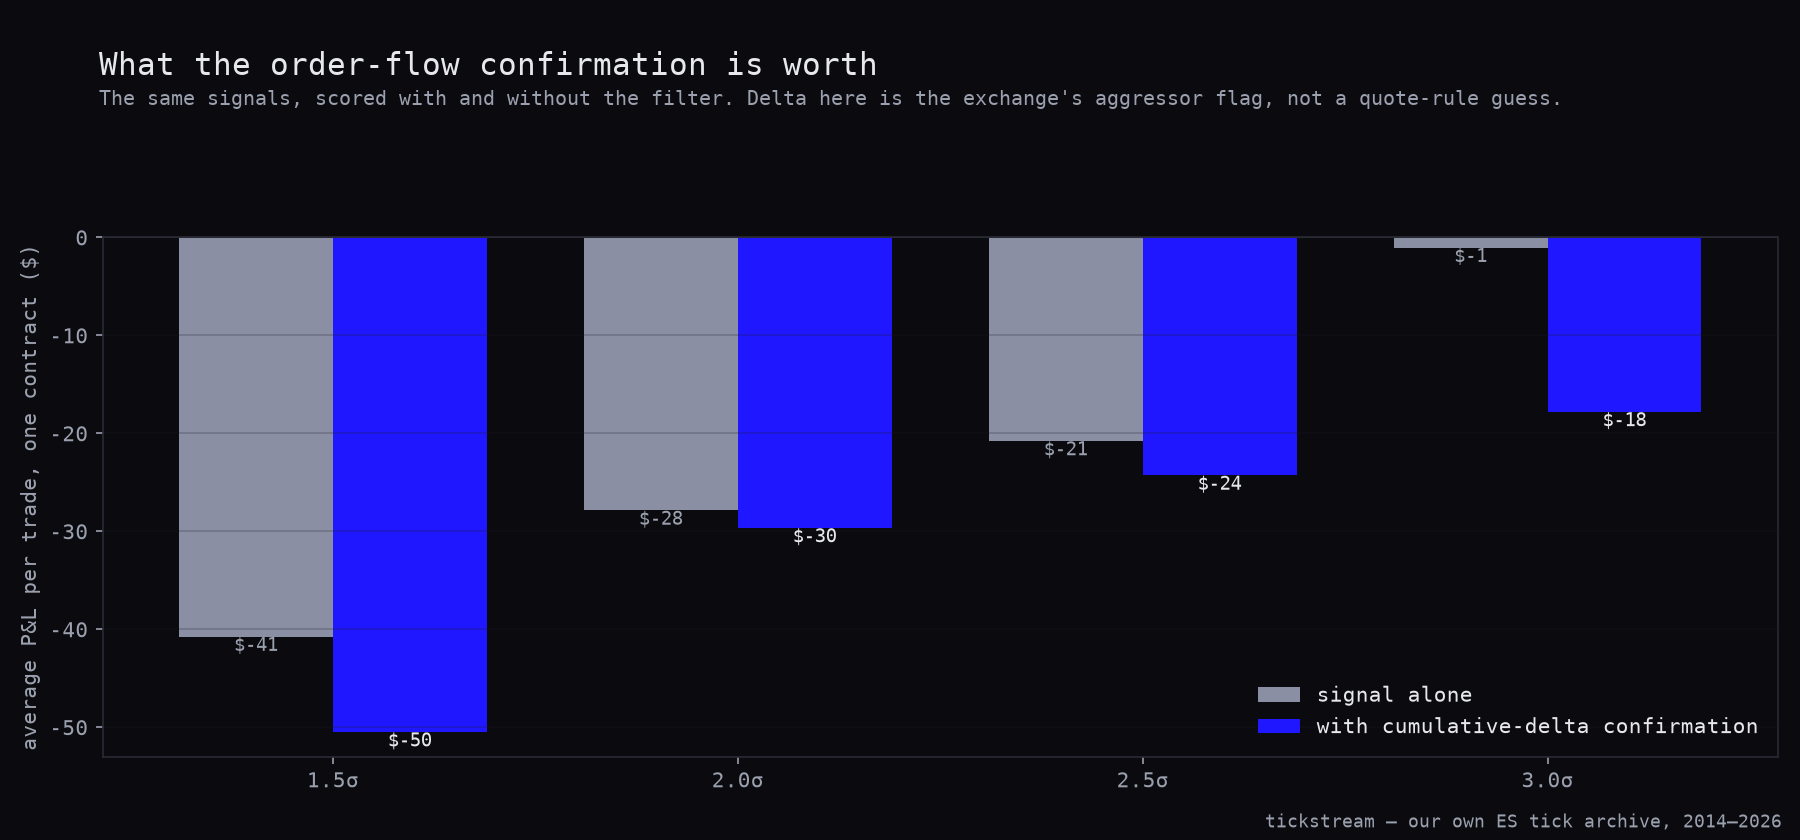
The filter’s contribution, per trade, at each width:
| Band | Filter effect per trade | Trades kept | Discarded |
|---|---|---|---|
| 1.5σ | −$9.75 | 2,987 of 3,216 | 7.1% |
| 2.0σ | −$1.79 | 2,657 of 3,195 | 16.8% |
| 2.5σ | −$3.52 | 1,896 of 2,838 | 33.2% |
| 3.0σ | −$16.76 | 912 of 1,718 | 46.9% |
Helped in 0 of 4 bands.
The filter is at its worst where it is most aggressive. At 3.0σ it throws away nearly half the trades and costs $16.76 on each of the ones it keeps. Below that, the damage does not order neatly. The tightest band is where the filter discards the fewest trades, 7.1% of them, and it still costs $9.75 there — more than five times what it costs at 2.0σ. So “the damage scales with how much the rule does” holds across the three widest bands and breaks at the tightest one. That is a weaker claim than we first wrote, and it is the one the table supports.
Make the mechanism concrete, because it is simple. The confirmation is a rule that throws trades away. A rule that throws trades away is only worth having if the trades it throws away are worse than the ones it keeps. Here they are better. Four times out of four.
This is not the first time we have measured it, though it is the first time on this setup. We have never published an NQ version of this exact test — VWAP sigma bands with a cumulative-delta confirmation — so there is no companion verdict to set beside it. What exists is broader and older. When we tested the whole order-flow indicator family as a filter on Nasdaq futures, it made 22 of 25 otherwise-profitable strategies worse, costing an average of 0.39 Sharpe, and the holdout agreed. The honest use we settled on there was execution, not direction: delta tells you something real about where the liquidity is sitting right now, and nothing usable about where price goes next. That study is here.
What makes this run worth publishing is that we were not looking for it. The test was built to kill the VWAP fade on the S&P, which it does. The filter result fell out of the same run because scoring both arms costs nothing once the signals exist. A replication you did not go hunting for is worth more than one you did.
The first-touch scalp
The other half of the VWAP family is the scalp: rest a limit at VWAP on the session’s first touch, take a small target against a small stop, be done. We ran it with a 3-point target and a 4-point stop, one trade a session, timeout after 30 bars.
| First-touch VWAP scalp | |
|---|---|
| Trades | 3,131 |
| Win rate | 52.4% |
| Average per trade | −$31.18 |
| Total, one contract | −$97,611.36 |
| Median trade | +$34.25 |
| Profit factor | 0.655 |
| Sharpe | −3.06 |
| t | −10.91 |
| p | 0.0000 |
| Max drawdown | $98,988.73 |
Exits split 1,481 targets, 1,092 stops, 558 timeouts.
Look at what the 52.4% is doing there. More than half the trades win. The median trade is +$34.25. And the strategy loses $97,611.36. The reason is arithmetic, not market structure: the largest win in the entire run is $120.50 and the largest loss is −$229.50, because a 3-point target nets $120.50 after costs while a 4-point stop costs $229.50. A geometry like that needs well over half the trades to win before it breaks even, and 1,481 targets against 1,092 stops does not get there.
This is the single most common way a losing strategy is sold as a winning one. Quote the win rate, never the payoff. We wrote the same finding up on the wickless candle setup, where an 88% win rate came entirely from the exit geometry and the signal contributed nothing. The mechanism here is identical, and 52.4% is a much easier number to believe than 88%.
Why the delta measurement is ours
There is a fair objection to every null result on order flow, and it is about the data rather than the method. If your delta is reconstructed with a quote rule, guessing the aggressor from whether a print landed nearer the bid or the ask, then a null could just be measurement noise. Blurry input, blurry answer.
That objection does not apply here. The delta in these bars is the exchange’s own aggressor flag, carried on every print in our ES tick archive back to 2014. There is no reconstruction step and nothing to misclassify. When the filter drops 806 of the 1,718 trades at the 3.0σ band, it is reading a real signal about who crossed the spread. It is just reading it in the wrong direction for this purpose.
The other thing the archive buys is the window. Twelve and a half years and roughly 3,640 cash sessions is what turns “the filter didn’t help in our sample” into a grid of four widths that all agree.
What we changed in our own book
Nothing, and that is the honest answer.
We already do not use order flow as a directional filter anywhere in the live book. That decision was made on the NQ work and it has not moved. This run is the confirmation on a second index with a different setup, which is the kind of evidence that stops a settled question from being reopened every six months.
Two things are logged rather than acted on. The VWAP fade family is closed on ES, all four widths and both arms, and does not get re-tested without a new mechanism rather than a new parameter. And the 3.0σ near-zero row goes in the reference file as a baseline. When a future S&P mean-reversion test prints something near $0 a trade at a profit factor near 1, that is what the market pays for reversion at three sigma. It is not evidence that the code is broken.
The ES tick archive this ran on, with the exchange’s aggressor side on every print back to 2014, is in our historical data packages.
Methodology: ES continuous front-month, 1-minute bars resampled from our own trade prints, 1,233,006 cash-session bars across 3,643 sessions, 2 January 2014 to 10 September 2026, RTH only. Session VWAP and its volume-weighted running standard deviation are rebuilt at each cash open. Band signal on a bar touching VWAP ± k·σ; entry at the band, target the session VWAP, stop 0.75 bands beyond the entry, timeout 60 bars, at most one trade a session, first qualifying touch only. The confirmation arm additionally requires the session cumulative delta to disagree with the excursion. Cumulative delta is summed from the exchange aggressor flag on every print, not from a quote-rule reconstruction. First-touch scalp: limit at session VWAP on the first bar whose range contains it, direction faded from the side the bar opened on, 3-point target, 4-point stop, timeout 30 bars, one trade a session. One contract throughout, $4.50 commission plus two ticks of slippage per round trip, $29.50 on ES. Per-trade Sharpe and the t-statistic are computed on the closed-trade P&L series; p-values are two-sided and reported to four decimal places. The order-flow-as-filter comparison comes from our earlier NQ indicator study.
Frequently asked questions
Does cumulative-delta confirmation improve a VWAP band fade?
No. On the same signals and the same bars it cost money at all four band widths: −$9.75 a trade at 1.5σ, −$1.79 at 2.0σ, −$3.52 at 2.5σ and −$16.76 at 3.0σ. It helped in 0 of 4 bands. The trades the filter throws away are better than the ones it keeps.
Is the VWAP band fade itself profitable on ES?
No. All eight configurations lose. The worst of the eight is the 1.5σ band with delta confirmation, at −$50.50 a trade over 2,987 trades; the same band without the filter is next at −$40.75 with t = −9.33. The mildest is the unfiltered 3.0σ band at −$1.05 over 1,718 trades with t = −0.10, which is a fair price rather than an edge.
Why does the first-touch VWAP scalp lose with a 52.4% win rate?
Because a 3-point target against a 4-point stop needs well over half the trades to win before costs are even counted. The largest win in the run is $120.50 and the largest loss is −$229.50. Over 3,131 trades it took 1,481 targets and 1,092 stops and still lost $31.18 a trade, $97,611.36 in total, at a profit factor of 0.655.
Could the result be blamed on a noisy delta reconstruction?
Not here. The delta in these bars is the exchange's own aggressor flag from our ES tick archive, not a quote-rule guess. The 3.0σ band drops from 1,718 trades to 912 when the filter is applied, so the filter is clearly reading something, it is just reading it backwards.
Does this match your earlier Nasdaq work on order flow?
It agrees with it, but it is not the same test. We have never run VWAP sigma bands with a delta confirmation on NQ, so there is no matching article to compare. What the NQ work measured was order flow as a filter in general, and it made 22 of 25 otherwise-profitable strategies worse, an average of −0.39 Sharpe. This ES test was built to kill the VWAP fade and the filter result fell out of it, which is the version of a replication we trust more.