Buying a SPY Option Loses Money in 25 of 32 Buckets Once You Pay the Spread
We held 6,105,700 contract-days of SPY options for one session each, matched contract to contract, from our own OPRA recording. Sixteen of thirty-two buckets make money at the mid and only seven survive paying the spread, an average gap of 5.69 percentage points per session. We also caught a survivorship bug in our own first run, then re-ran the biased version to measure it: filtering the exit leg on having a bid adds 2.02 percentage points per session averaged across the grid, and 13.33 points on short-dated far out-of-the-money calls, which read +13.80% biased against +0.47% corrected.
We held every SPY option in our chain for one session and measured what the buyer got. Same expiry, same strike, same right, one session apart: 6,105,700 contract-days, 2 January 2019 to 28 May 2026, from our own OPRA recording.
Sixteen of thirty-two buckets make money at the mid price. Seven make money once you buy the ask and sell the bid.
Because these are matched contracts rather than two different options compared to each other, this is a real holding-period return. It is what happened to the position, not what happened to a strike.
We got this wrong the first time
This is the largest single correction in this series, so it goes near the top rather than in a footnote.
The exit leg must not be filtered on the option having a bid. An option that goes bidless overnight is a total loss for the person holding it. Dropping those rows is survivorship bias, and it is the bias that makes cheap options look like free lottery tickets, because the cheap options are precisely the ones that go to zero.
Our first run had exactly that filter. Rather than describe the damage from memory, we re-ran the biased variant and measured it against the corrected one in all thirty-two buckets.
Across the grid the filter adds 2.02 percentage points of return per session. The worst single bucket is short-dated 10-delta calls, +16.35% biased against +2.15% corrected, a gap of 14.20 points. Short-dated far out-of-the-money calls read +13.80% biased against +0.47% corrected.
| Bucket | Biased | Corrected | Bias |
|---|---|---|---|
| 1–7 dte / call / at the money | +7.48% | +3.12% | 4.36 pp |
| 1–7 dte / call / 25 delta | +12.82% | +4.31% | 8.51 pp |
| 1–7 dte / call / 10 delta | +16.35% | +2.15% | 14.20 pp |
| 1–7 dte / call / far out of the money | +13.80% | +0.47% | 13.33 pp |
| 1–7 dte / put / 10 delta | −2.59% | −12.40% | 9.81 pp |
| 1–7 dte / put / far out of the money | −15.79% | −22.26% | 6.47 pp |
Nothing about the options changed between the two runs. The only difference was whether the losers were in the sample.
One more admission. Our very first run also filtered the exit leg on a minimum price, not only on having a bid, and it produced a larger number still. We are not quoting that figure because we cannot regenerate it; the 2.02-point average above comes from the re-run with the bid filter alone.
Here is what makes that concrete. The share of contracts with no bid the next session:
| Bucket | Bidless next session |
|---|---|
| 1–7 dte / call / 10 delta | 12.59% |
| 1–7 dte / call / far out of the money | 12.57% |
| 1–7 dte / put / 10 delta | 10.39% |
| 1–7 dte / put / far out of the money | 8.54% |
| 31–90 dte / call / 25 delta | 0.00% |
| 31–90 dte / call / at the money | 0.00% |
| 31–90 dte / put / 10 delta | 0.00% |
| 31–90 dte / put / at the money | 0.00% |
One in eight short-dated cheap calls has no bid the next morning, against zero for most of the 31-to-90-day buckets. A filter that looks harmless on the monthly chain deletes an eighth of the sample on the weekly one, and it deletes only the losers.
The rule
- One chain snapshot per session, SPY only, from our own OPRA recording.
- Entry requires a genuine two-sided market and a mid of at least five cents.
- Exit is the same contract one session later: same expiry, same strike, same right.
- The exit allows a zero bid. A bidless contract is marked as the total loss it is, not dropped.
- At the mid: enter at the mid, exit at the mid. This is what a model assumes.
- As a taker: buy the ask, sell the bid. This is what a person gets.
- Bucket by days to expiry (1–7, 8–30, 31–90, 90+) and by moneyness (at the money, 25 delta, 10 delta, far out of the money). Contracts outside those moneyness bands are excluded.
The grid
Thirty-two buckets. This is a reference table rather than an argument; the two return columns are the same trade priced two ways.
| Expiry | Right | Moneyness | Contract-days | At the mid | As a taker | Share up | Bidless | Mean price |
|---|---|---|---|---|---|---|---|---|
| 1–7 | call | at the money | 19,395 | +3.12% | +0.95% | 44.92% | 4.06% | $3.801 |
| 1–7 | call | 25 delta | 21,712 | +4.31% | +1.56% | 38.06% | 7.59% | $1.440 |
| 1–7 | call | 10 delta | 27,335 | +2.15% | −3.76% | 28.18% | 12.59% | $0.343 |
| 1–7 | call | far out of the money | 21,465 | +0.47% | −14.05% | 22.15% | 12.57% | $0.102 |
| 1–7 | put | at the money | 19,847 | −5.91% | −8.28% | 34.10% | 4.32% | $3.922 |
| 1–7 | put | 25 delta | 30,314 | −8.08% | −10.43% | 28.19% | 7.18% | $1.780 |
| 1–7 | put | 10 delta | 53,576 | −12.40% | −16.60% | 20.41% | 10.39% | $0.510 |
| 1–7 | put | far out of the money | 117,508 | −22.26% | −32.40% | 13.76% | 8.54% | $0.126 |
| 8–30 | call | at the money | 81,896 | +1.73% | +0.57% | 48.28% | 0.00% | $6.858 |
| 8–30 | call | 25 delta | 83,701 | +3.03% | +1.34% | 45.16% | 0.00% | $2.554 |
| 8–30 | call | 10 delta | 99,442 | +4.16% | +0.16% | 39.53% | 0.02% | $0.602 |
| 8–30 | call | far out of the money | 121,564 | −0.68% | −12.86% | 30.69% | 0.23% | $0.136 |
| 8–30 | put | at the money | 85,659 | −2.10% | −3.81% | 38.97% | 0.00% | $7.466 |
| 8–30 | put | 25 delta | 137,722 | −2.97% | −4.27% | 35.52% | 0.00% | $3.496 |
| 8–30 | put | 10 delta | 216,847 | −5.18% | −7.37% | 29.99% | 0.03% | $1.059 |
| 8–30 | put | far out of the money | 419,506 | −8.65% | −16.23% | 22.19% | 0.08% | $0.228 |
| 31–90 | call | at the money | 85,487 | +1.13% | +0.12% | 50.07% | 0.00% | $11.285 |
| 31–90 | call | 25 delta | 81,425 | +1.87% | +0.34% | 47.57% | 0.00% | $4.210 |
| 31–90 | call | 10 delta | 84,282 | +2.39% | −0.99% | 43.46% | 0.01% | $1.006 |
| 31–90 | call | far out of the money | 108,984 | +0.29% | −11.49% | 35.17% | 0.15% | $0.188 |
| 31–90 | put | at the money | 92,325 | −1.20% | −3.02% | 40.16% | 0.00% | $13.010 |
| 31–90 | put | 25 delta | 146,273 | −1.29% | −2.28% | 37.86% | 0.00% | $6.335 |
| 31–90 | put | 10 delta | 205,286 | −1.92% | −3.49% | 34.20% | 0.00% | $2.115 |
| 31–90 | put | far out of the money | 350,877 | −1.82% | −7.13% | 29.71% | 0.06% | $0.488 |
| 90+ | call | at the money | 284,382 | +0.60% | −2.54% | 52.83% | 0.00% | $24.452 |
| 90+ | call | 25 delta | 255,596 | +1.02% | −5.93% | 51.24% | 0.00% | $9.511 |
| 90+ | call | 10 delta | 275,297 | +1.36% | −16.30% | 48.50% | 0.61% | $2.605 |
| 90+ | call | far out of the money | 358,271 | +3.64% | −24.19% | 43.17% | 1.56% | $0.458 |
| 90+ | put | at the money | 394,327 | −0.34% | −3.43% | 42.20% | 0.00% | $57.521 |
| 90+ | put | 25 delta | 559,354 | −0.40% | −3.31% | 41.47% | 0.00% | $17.622 |
| 90+ | put | 10 delta | 616,266 | −0.40% | −6.49% | 40.26% | 0.01% | $6.057 |
| 90+ | put | far out of the money | 649,779 | +0.39% | −10.56% | 38.22% | 0.46% | $1.530 |
The gap is bigger than most edges
Sixteen of the thirty-two cells are positive at the mid. Seven are still positive as a taker. The average distance between the two columns is 5.69 percentage points per session.
The best taker cell is short-dated 25-delta calls at +1.56%. The worst is short-dated far out-of-the-money puts at −32.40%.
All seven survivors are calls, and all seven sit at 25 delta or at the money. Nothing further out than 25 delta survives the spread anywhere in the grid.
The general point is worth stating without hedging. A backtest run on mid prices is not slightly optimistic about options. It is wrong by more than most edges are worth. The best cell in the entire grid returns +1.56% a session as a taker, and the average cell loses 5.69 points to the spread alone. Compounded over a year of sessions, that gap is not a haircut, it is the entire result.
This is where the cost measurement in our companion article gets used for something. That piece found a 14.13% round-trip cost on the average traded SPY option. This piece is what that cost does to a position over one session.
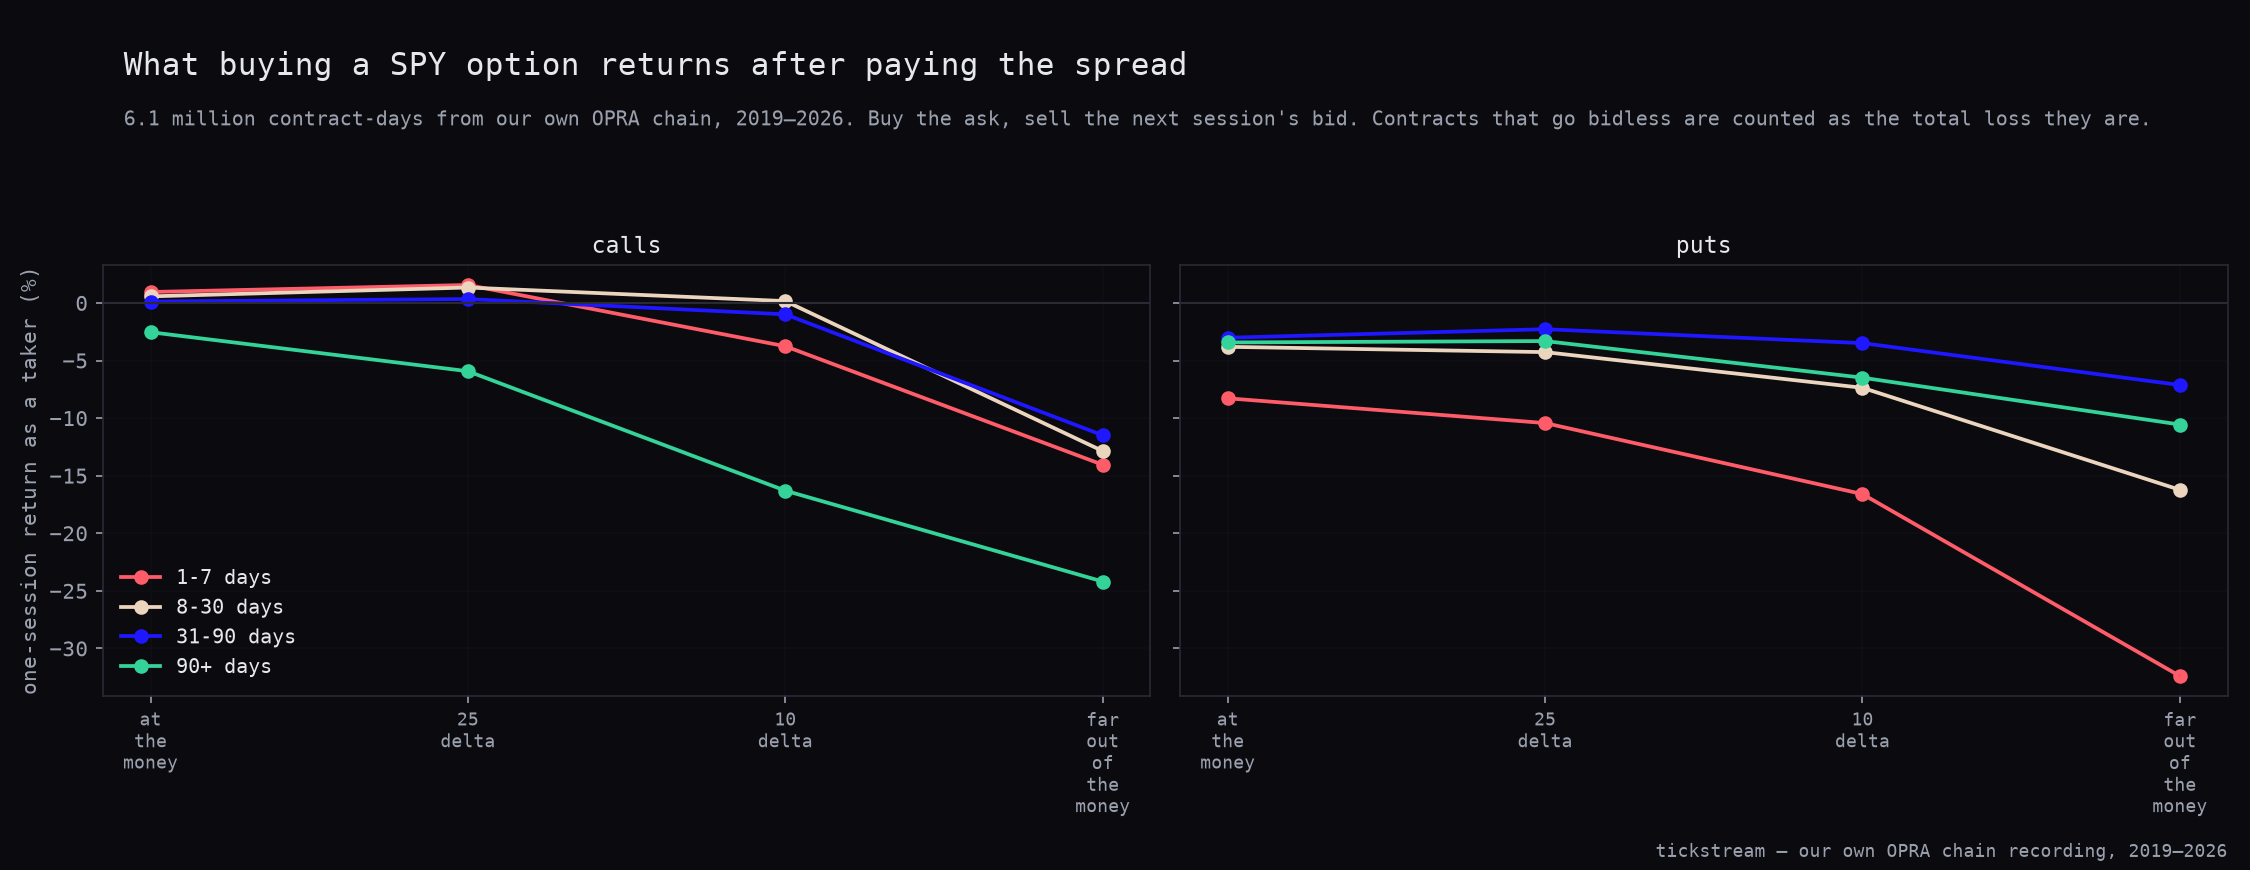
The first chart shows the taker column across moneyness, calls on the left and puts on the right, with one line per expiry bucket. Read it left to right: the surface slopes away from zero as the strike moves away from the money, in all eight rows.
Calls against puts
The two sides do not behave the same way and averaging them hides the result.
| Contract-days | At the mid | As a taker | Share up | |
|---|---|---|---|---|
| Calls | 2,010,234 | +1.76% | −9.17% | 45.23% |
| Puts | 4,095,466 | −2.60% | −7.91% | 35.27% |
Two things come out of that table.
Calls are positive at the mid and deeply negative as a taker. The index drifts up and the call captures that drift, which is the +1.76%. Then the buyer hands it to the market maker and keeps −9.17%. The drift is real and it does not belong to the person paying for it.
Puts are negative in both columns and are traded twice as much: 4,095,466 contract-days against 2,010,234 for calls. That is the whole insurance story in two numbers. People buy protection, the pricing reflects that they will, and buying it costs money in both the model column and the real one. A put buyer is up on 35.27% of sessions.
The shape across moneyness
Using the taker column, the far out-of-the-money cell is the worst cell in every one of the eight expiry-and-side rows. Not the second worst, the worst, on both sides and at every expiry.
The extremes: −32.40% on short-dated far out-of-the-money puts, and −24.19% on 90-day-plus far out-of-the-money calls. Against that, every cell that survives the spread sits at 25 delta or at the money, and the best of them is +1.56%.
The reason is one sentence long, and it is not about the options. The relative spread is largest exactly where the premium is smallest, because the one-cent minimum increment is a floor and a ten-cent option is not. That is the measurement in our companion article on what SPY options cost to trade, where same-day far-out-of-the-money contracts run to a 66.67% round trip while at-the-money 31-to-90-day contracts cost 0.57%.
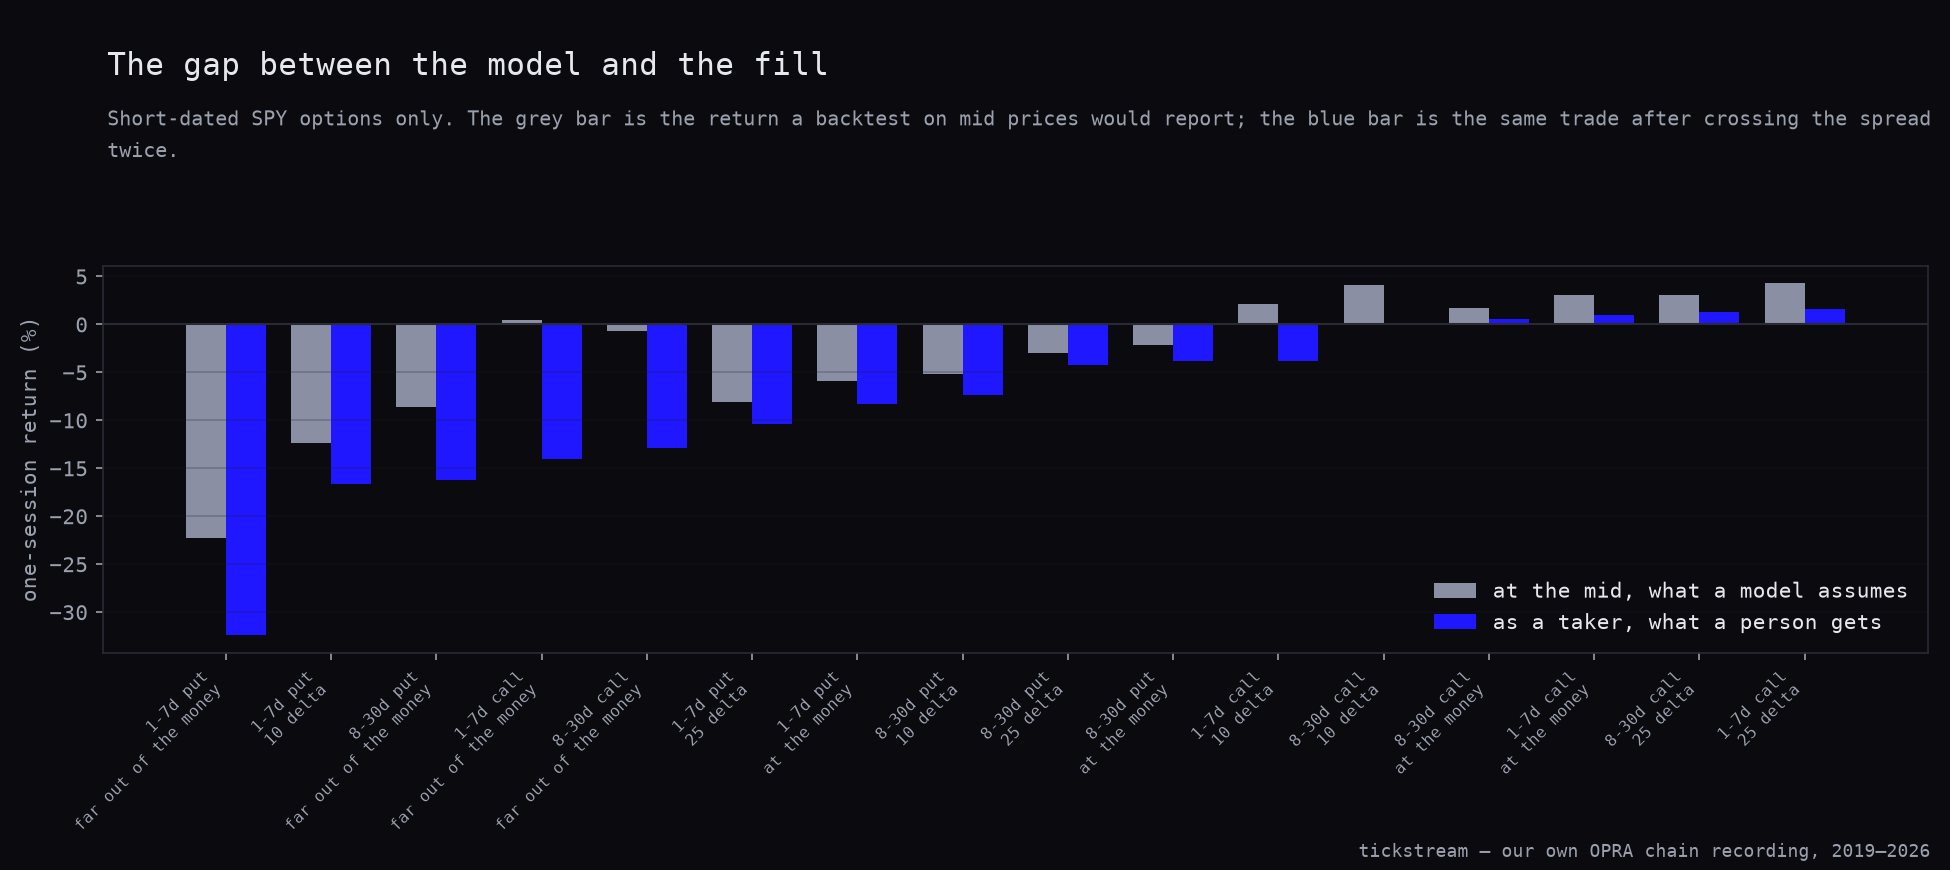
Note what this does to the at-the-mid column on the same rows. Ninety-day-plus far out-of-the-money calls are the third-best cell in the grid at the mid, +3.64%, and the second-worst cell in the grid as a taker, −24.19%. The same contracts, the same sessions. Everything between those two figures is the fill.
The second chart isolates the short-dated buckets and puts the two columns next to each other, sorted by the taker return. The grey bar is what a mid-price backtest would have reported and the blue bar is the same trade after crossing the spread twice.
What this does not say
It does not say options cannot be traded profitably.
It says the one-session buy-and-hold return of an average contract is negative after the spread in 25 of 32 buckets. That is a statement about the average contract held passively for one session, and about nothing else.
So any profitable options business is being paid for something other than holding the option. It is being paid for structure, for timing, or for selling rather than buying. A spread trade pays one side of the bid-ask instead of two. A signal that fires on one session in forty is not the average session. And the sign on every figure in the grid flips for whoever was on the other end of it.
We are not testing those here. This article measures the baseline that all three have to beat, and the baseline is a long way below zero.
What we changed in our own book
Nothing, because we do not run a long-options sleeve. What changed is the review standard.
Every options backtest in this series now has to report the taker column, and any exit filter that touches liquidity gets checked against the bidless share of the bucket it is filtering. Our first run passed every sanity check we had and was wrong by 13.33 points on the bucket we were quoting. It looked plausible because it was internally consistent; the sample was just missing its losers.
If a published options result does not say whether it priced the exit at the mid, the number it reports is not the number a buyer gets, and the difference on our grid averages 5.69 points a session.
The ES archive this series runs against is for sale in the historical data packages, ticks back to 2014.
Methodology: SPY options only, from our own OPRA recording, one snapshot per session. 6,105,700 contract-days from 2 January 2019 to 28 May 2026. One-session holds, matched contract to contract: same expiry, same strike, same right, one session apart. The entry leg requires a genuine two-sided market and a mid of at least five cents. The exit leg allows a zero bid, so a contract that goes bidless is counted as a total loss rather than dropped; this is the correction described above, and re-running the biased variant with the bid filter alone puts it at 2.02 percentage points per session averaged over the 32 buckets, 13.33 points on short-dated far out-of-the-money calls (+13.80% against +0.47%) and 14.20 points on short-dated 10-delta calls (+16.35% against +2.15%). Our very first run also filtered the exit on a minimum price and reported a larger figure again; it is not quoted anywhere here because it cannot be regenerated. Returns are reported twice: at the mid, and as a taker who buys the ask and sells the bid. Buckets are days to expiry 1–7, 8–30, 31–90 and 90+, against at the money, 25 delta, 10 delta and far out of the money; contracts outside those moneyness bands are excluded. Cells are weighted by contract count. Our OPRA chain store starts in 2019 while the ES tick archive this series is built on goes back to 2014, so this is a seven-year measurement inside a twelve-and-a-half-year series and it cannot speak to the five earlier years. Sessions after 29 May 2026 are excluded because the recorder’s last snapshot is sometimes a truncated post-close chain. No futures trades are simulated here; where this series does simulate them the cost convention is $4.50 commission plus two ticks per round trip, which is $29.50 on one ES contract.
Frequently asked questions
Does buying SPY options make money?
Held one session and matched contract to contract, 16 of our 32 buckets are positive at the mid price. Only 7 are still positive once you buy the ask and sell the bid. Across 6,105,700 contract-days the average gap between the two columns is 5.69 percentage points per session.
What was the survivorship bug in this test?
Our first run filtered the exit leg on the option still having a bid, which silently deleted every contract that went to zero overnight. We re-ran that biased version across all 32 buckets rather than describe it from memory: it averages 2.02 percentage points of extra return per session. The worst bucket is short-dated 10-delta calls, +16.35% biased against +2.15% corrected, and short-dated far out-of-the-money calls read +13.80% against +0.47%.
How often do cheap options go bidless overnight?
12.59% of short-dated 10-delta calls and 12.57% of short-dated far out-of-the-money calls have no bid the next session. Most of the 31-to-90-day buckets sit at 0.00%. The survivorship problem is concentrated exactly where the cheap lottery-ticket options are.
Are calls better than puts to buy?
At the mid, yes: calls return +1.76% a session against −2.60% for puts. As a taker the ranking flips, calls at −9.17% and puts at −7.91%, because the index drift in the call is smaller than the spread a call buyer pays. Puts are still traded twice as much, 4,095,466 contract-days against 2,010,234.
Which SPY option bucket is the worst to buy?
Short-dated far out-of-the-money puts, at −32.40% per session as a taker, across 117,508 contract-days. They are up on only 13.76% of sessions and have a mean price of $0.126. The best bucket is short-dated 25-delta calls at +1.56%.