The Average Traded SPY Option Costs 14.13% of Its Value in Bid-Ask
Across 32,900 daily cells from our own OPRA recording, the volume-weighted relative bid-ask on SPY options is 14.13% of the option's value. A round trip crosses that spread once, so it costs 14.13% of the premium before commission. The range across one product on one underlying is two orders of magnitude: 0.57% at the money 31 to 90 days out, 66.67% far out of the money on expiry day. Total SPY option volume grew from 0.41bn contracts in 2019 to a peak of 1.02bn in 2025, and the at-the-money zero-day spread did not follow it down, ending at 12.84% in 2026 after 16.83% in 2019.
Weighted by the volume that actually traded, the bid-ask on a SPY option is 14.13% of the option’s value. A round trip crosses that spread once, in at the ask and out at the bid, so it costs the same 14.13% of the premium before a cent of commission. That is measured across 32,900 daily cells from our own OPRA recording, 2019 to 2026.
The relative spread is the bid-ask divided by the mid. Weighting it by traded volume means this is not a survey of the chain, most of which nobody touches. It is what the average contract that actually changed hands really paid.
Which implies something worth carrying around: an options strategy has to be right by more than a seventh of the premium before it breaks even, and almost nobody backtests it that way.
Why we measured this
Almost every options article in this series ends the same way. The effect is real and the spread eats it. We wrote that about the variance risk premium, we wrote it about gamma walls, and we have written it about half a dozen flow signals in between.
At some point the sentence stops being an explanation and starts being an excuse. So this article measures the spread directly, everywhere, and then we quote every other result against it.
The rule
No trades are simulated here. It is a measurement.
- One chain snapshot per session, SPY only, from our own OPRA recording.
- Keep contracts with a genuine two-sided market. A one-sided quote has no spread to measure.
- Relative spread = (ask − bid) / mid. Round trip = the same figure, because buying at the ask costs half a spread against the mid and selling at the bid costs the other half.
- Bucket every contract by days to expiry (0, 1–7, 8–30, 31–90, 90+) and by moneyness (at the money, 25 delta, 10 delta, far out of the money).
- Medians throughout, not means. A handful of very wide quotes would otherwise decide the answer.
The grid
Twenty cells. The left-hand columns are what it costs, the right-hand column is where people actually trade. The round-trip column repeats the relative spread, because one round trip crosses the spread exactly once.
| Expiry | Moneyness | Median relative spread | Round trip, % of premium | Median spread | Median mid | Share of all volume |
|---|---|---|---|---|---|---|
| 0 dte | at the money | 13.24% | 13.24% | $0.05 | $0.422 | 2.8% |
| 0 dte | 25 delta | 15.38% | 15.38% | $0.01 | $0.095 | 3.0% |
| 0 dte | 10 delta | 40.00% | 40.00% | $0.01 | $0.025 | 5.2% |
| 0 dte | far out of the money | 66.67% | 66.67% | $0.01 | $0.015 | 8.6% |
| 1–7 dte | at the money | 0.86% | 0.86% | $0.02 | $2.936 | 10.7% |
| 1–7 dte | 25 delta | 1.34% | 1.34% | $0.02 | $1.203 | 13.0% |
| 1–7 dte | 10 delta | 3.57% | 3.57% | $0.01 | $0.325 | 11.1% |
| 1–7 dte | far out of the money | 28.57% | 28.57% | $0.01 | $0.035 | 9.6% |
| 8–30 dte | at the money | 0.72% | 0.72% | $0.04 | $5.909 | 4.3% |
| 8–30 dte | 25 delta | 1.06% | 1.06% | $0.03 | $2.617 | 5.8% |
| 8–30 dte | 10 delta | 2.00% | 2.00% | $0.02 | $0.768 | 5.5% |
| 8–30 dte | far out of the money | 13.33% | 13.33% | $0.01 | $0.082 | 4.0% |
| 31–90 dte | at the money | 0.57% | 0.57% | $0.06 | $10.626 | 2.0% |
| 31–90 dte | 25 delta | 0.76% | 0.76% | $0.04 | $5.005 | 3.9% |
| 31–90 dte | 10 delta | 1.27% | 1.27% | $0.02 | $1.560 | 3.1% |
| 31–90 dte | far out of the money | 5.71% | 5.71% | $0.01 | $0.215 | 2.9% |
| 90+ dte | at the money | 2.12% | 2.12% | $0.63 | $29.840 | 0.8% |
| 90+ dte | 25 delta | 1.74% | 1.74% | $0.20 | $13.004 | 1.5% |
| 90+ dte | 10 delta | 3.34% | 3.34% | $0.11 | $4.071 | 1.2% |
| 90+ dte | far out of the money | 11.31% | 11.31% | $0.04 | $0.661 | 0.9% |
The cheapest cell in the grid is at the money, 31 to 90 days out, at 0.57%. The dearest is far out of the money expiring today, at 66.67%. That is two orders of magnitude across one product on one underlying, in the same session, on the same screen.
Note where the absolute spread stops helping. It is one cent in seven of the twenty cells, and those seven are not the cheap ones. Once the quote hits the minimum increment, the only thing that moves the relative spread is the price of the contract.
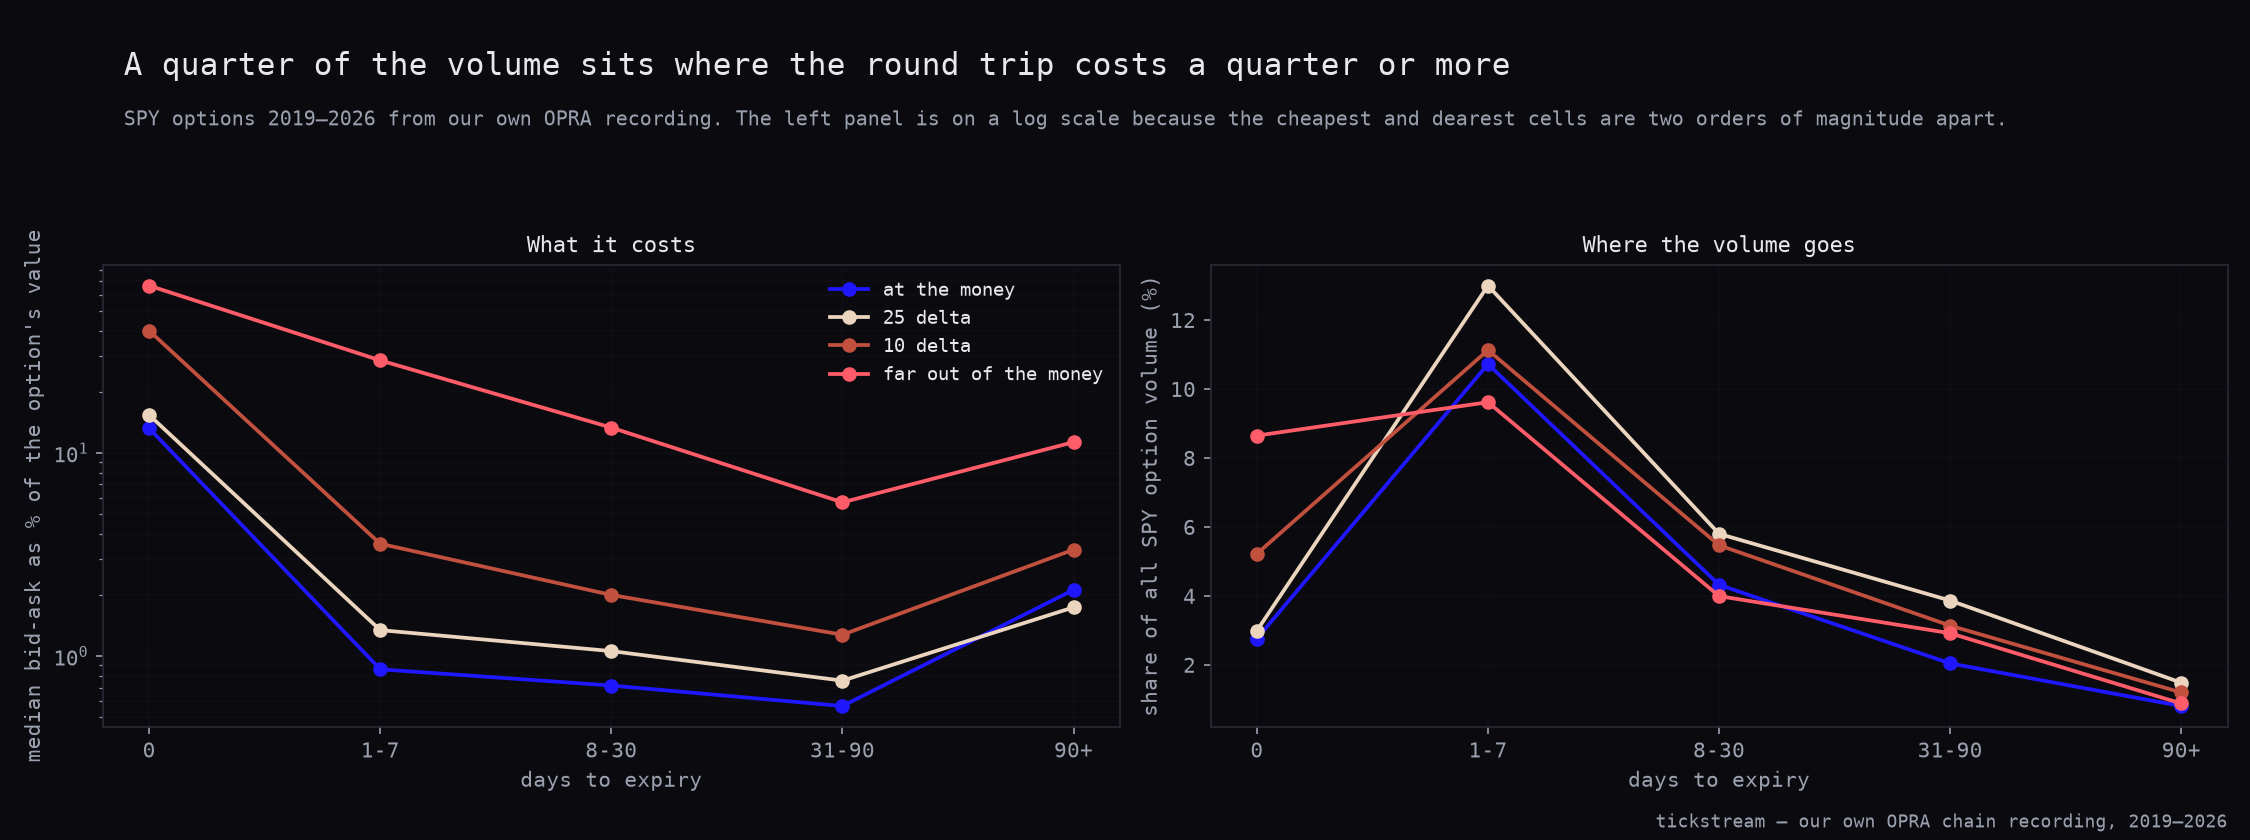
The chart puts both halves side by side, and the point of pairing them is that they do not line up: the volume does not sit where the cost is low. The left panel is on a log scale, because a linear axis cannot show 0.57% and 66.67% at once. The right panel is the same grid measured in volume. Read them against each other rather than one at a time.
Where the volume goes against where the cost is
The busiest single cell in the whole grid is 1–7 days at 25 delta. It carries 13.0% of all volume at a median relative spread of 1.34%, which is the whole round trip. That one is fine. It is a liquid, sensibly priced contract and nobody trading it is being quietly taxed.
The problem is one column and one row.
Read down the far-out-of-the-money column: 8.6%, 9.6%, 4.0%, 2.9% and 0.9% of all volume, which is 26.0% of everything traded. The cheapest of those five cells is a 5.71% round trip and the dearest is 66.67%.
Read across the zero-day row: 2.8%, 3.0%, 5.2% and 8.6%, which is 19.6% of all volume. Every cell in that row costs at least 13.24% of the premium to open and close, and the two busiest cells in it — 10 delta and far out of the money, 13.8% of everything between them — cost 40.00% and 66.67%.
Add up every cell in the grid where the round trip takes a quarter of the premium or more and you get 23.4% of all SPY option volume. Close to a quarter of the tape trades in contracts where the spread alone costs between a quarter and two thirds of what the contract is worth.
We are not moralising about that. There are reasons to buy a lottery ticket and we are not going to pretend otherwise. But the arithmetic is not optional, and the arithmetic is unusually well hidden here.
These are the cheapest-looking options on the screen and the most expensive ones to own. A far-out-of-the-money contract a week from expiry has a median mid of $0.035 and a median spread of $0.01. That is a 28.57% relative spread, so more than a quarter of the premium goes on the round trip. The absolute spread being one cent is exactly why it does not feel like one.
The worked example
Take the good case. At the money, 8 to 30 days out, one of the four cheapest cells in the grid.
| Value | |
|---|---|
| Median mid | $5.91 |
| Median spread | $0.04 |
| Round trip, dollars per contract | $4.00 |
| Round trip, % of premium | 0.72% |
The arithmetic is the whole method and it takes ten seconds. The spread is $0.04, a contract is 100 shares, so buying at the ask and selling back at the bid costs $4.00 once. That is 0.68% of a $591 contract, while the cell’s median relative spread is 0.72%, because a median of ratios is not the ratio of the medians. Do it fifty times a year and the spread alone has taken $200 a contract, a third of what one contract is worth.
Now do the same three-line sum on whatever you were actually about to trade. Mid, spread, divide. If the answer starts with a two-digit number, the trade has to be right by that much before it is worth doing, and the option that produced our headline is exactly that trade.
This is the good case.
Did it improve as volume grew?
The usual defence of zero-day options is that the volume brought the spreads in. Half of that is true.
| Year | Volume, bn contracts | ATM 0 dte spread | ATM 8–30 dte spread |
|---|---|---|---|
| 2019 | 0.41 | 16.83% | 1.18% |
| 2020 | 0.65 | 11.54% | 0.91% |
| 2021 | 0.63 | 9.42% | 0.72% |
| 2022 | 0.95 | 10.85% | 0.54% |
| 2023 | 0.90 | 8.03% | 0.45% |
| 2024 | 0.82 | 14.67% | 0.77% |
| 2025 | 1.02 | 14.51% | 0.66% |
| 2026 | 0.55 | 12.84% | 0.59% |
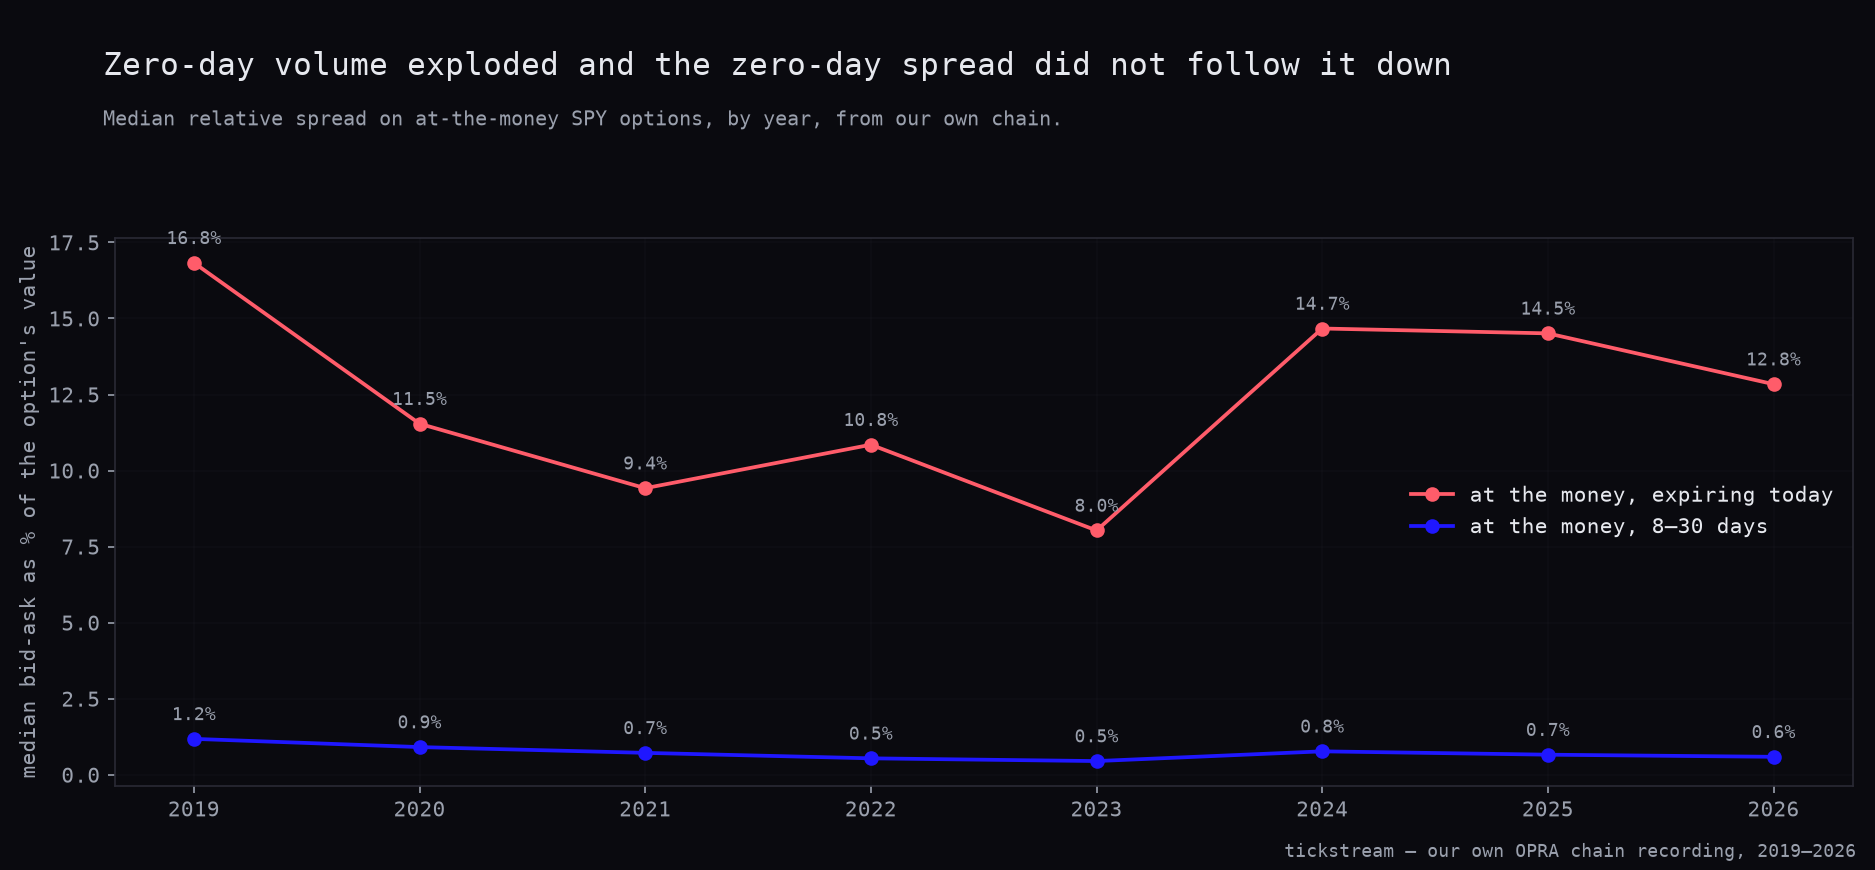
The monthly contract genuinely got better. At the money, 8 to 30 days out, the median relative spread went from 1.18% in 2019 to 0.59% in 2026. It roughly halved, and it did so fairly steadily.
The zero-day contract did not. It tightened through 2023, then widened again, and 2026 leaves it at 12.84%, wider than it was in 2021. The year-by-year figures are in the table above. Over the same window annual volume in our sample went from 0.41bn contracts to a peak of 1.02bn in 2025. The line that carried the volume growth is the line that did not improve.
The chart is the two series side by side with every point labelled. What to look at is 2023 onward, where they part company.
Here is our reading of that, and we want to label it as a reading rather than a measurement, because we did not test it.
Zero-day quoting is a different business from monthly quoting. A market maker in a $5.91 option is managing inventory over weeks and can afford to compete on a four-cent spread. A market maker in a $0.422 option is managing something that will be worth zero or a lot in six hours, and the tick is already as small as the exchange allows.
More volume in a product whose contracts are worth cents does not narrow a spread that is already one tick wide. The one-cent minimum increment is a floor, and at a forty-cent option that floor is the cost. Volume can only compress a spread that has room to compress.
What this explains in the rest of the series
Three results in this series get clearer with the grid next to them.
The variance risk premium article found a premium of −0.03 volatility points against a median spread cost of 0.76 volatility points on the same options. That result is often read as “the premium is small”. It is better read as: the premium was never the binding constraint. The spread was twenty-five times larger than the thing it was supposed to be eating, and this article is where that number comes from.
The zero-day article found that the tape did not change as zero-day share went from 8.6% to 53.8% of SPY option volume. This article adds the other half of that picture. Not only did the underlying not react, the instrument itself did not get cheaper to trade. Growth in a product is not the same thing as improvement in a product.
The gamma walls article found walls rejecting price 52.9% of the time against levels with no wall on them doing the same. If a signal that weak had been worth trading, it would have been traded through options, and the far-out-of-the-money column is where those trades live.
What we do with this
Every options result in this series now gets quoted against the relevant cell of the table above before we decide whether it is collectable. Not against a generic slippage assumption, and not against the at-the-money number, which is the friendliest one in the grid and almost never the cell the strategy is actually trading.
A reader can do exactly the same thing with three numbers: the mid, the quoted spread, and how often they intend to trade. Divide the second by the first, then multiply by the third. If that total is bigger than the edge, there is no trade, and no amount of backtest tuning will produce one.
The ES archive this series runs against is for sale in the historical data packages, ticks back to 2014.
Methodology: SPY option chains only, from our own OPRA recording, one snapshot per session. 32,900 daily bucket cells from 2 January 2019 to 29 May 2026. Only contracts with a genuine two-sided market are included; a one-sided quote has no spread to measure and is dropped. Relative spread is (ask − bid) / mid; the round trip is the same figure, because a crossed entry pays half a spread against the mid and a crossed exit pays the other half, before commission. Medians rather than means throughout, because a handful of very wide quotes would otherwise dominate every cell. Volume-weighted figures weight each cell’s relative spread by the contracts actually traded in it. Buckets are days to expiry 0, 1–7, 8–30, 31–90 and 90+, against at the money, 25 delta, 10 delta and far out of the money; contracts outside those moneyness bands are excluded. The 2026 volume figure covers a partial year, to 29 May. One limit is worth stating plainly: our OPRA chain store starts in 2019, so this is a seven-year measurement sitting inside a series whose ES tick archive goes back to 2014, and it cannot speak to the five earlier years the rest of this work uses. No trades are simulated here; where this series does simulate them the cost convention is $4.50 commission plus two ticks per round trip, which is $29.50 on one ES contract.
Frequently asked questions
How much does the bid-ask cost on a SPY option?
Weighted by the volume that actually traded, the bid-ask is 14.13% of the option's mid price. A round trip crosses that spread once — in at the ask, out at the bid — so opening and closing costs 14.13% of the premium before commission. That is the average across 32,900 daily cells from 2019 to 2026. Individual cells run from 0.57% to 66.67%.
Which SPY options are cheapest to trade?
At-the-money contracts 31 to 90 days out, at a median relative spread of 0.57%, which is what the whole round trip costs. At-the-money 8-to-30-day contracts are close behind at 0.72%. Both sit at a median mid above five dollars, and that denominator is most of the reason the percentage is small.
Why are cheap out-of-the-money options expensive?
Because the one-cent minimum increment is a floor and their price is not. Far-out-of-the-money contracts expiring the same day have a median mid of $0.015 against a median spread of $0.01, a relative spread of 66.67%, so two thirds of the premium goes on the round trip. The absolute spread being one cent is exactly why it does not feel expensive.
Did zero-day option spreads narrow as volume grew?
No. At-the-money zero-day spreads went 16.83% in 2019, 8.03% in 2023, then back up to 14.67% in 2024 and 14.51% in 2025, ending at 12.84% in 2026, while annual volume in our sample rose from 0.41bn contracts in 2019 to a peak of 1.02bn in 2025. The 8-to-30-day at-the-money spread did improve over the same years, from 1.18% to 0.59%.
How do I work out what a trade will cost me?
Take the mid and the quoted spread and divide. An at-the-money SPY option 8 to 30 days out has a median mid of $5.91 and a median spread of $0.04, which is $4.00 a contract for the round trip and 0.72% of the premium. Then multiply by how often you intend to do it.