Sixty-Four ES Brackets, Zero Winners, and the Expensive Part Is the Middle
We ran every stop-and-target pair from 2 to 40 ticks across the same 3,093 random ES entries, 64 cells in all, and none is positive. The best averages −$13.12 a trade, the worst −$40.61, the median −$23.79, and not one of the 64 beats simply holding to the close at −$8.36. The grid is a U rather than a ramp: the 2-tick and 40-tick stop rows average −$21.79 and −$21.71 a trade, eight cents apart, and every row between them is worse, the 12-tick row worst at −$28.22. The reason is in the excursion distribution: the median random long trades 16.0 ticks against you before it goes anywhere, and 86.3% of entries take at least 4 ticks of heat.
We opened one long at a random minute of each ES cash session for twelve and a half years, then scored the same 3,093 entries under 64 different stop-and-target combinations. Every one of the 64 loses money. The best averages −$13.12 a trade, the worst −$40.61, and not a single cell beats the null of holding to the close.
That is the headline, but it is not the useful part. The useful part is the distribution underneath it, which tells you how much room an ES trade needs before the question of a stop is even worth asking.
Why the entries are random
This is a measurement of cost, not a strategy test.
A bracket does two things at once. It caps a loss, and it also decides which of the trade’s future paths you are allowed to be in. Attach it to a signal and those two effects are tangled: a result could come from the entry, from the geometry, or from an interaction between them. So we removed the entry.
One long is opened at the open of a random minute in each cash session. Nothing about that entry carries information. The bracket is the only thing that changes from cell to cell, which means whatever separates the cells is the geometry and nothing else. The expected value of a random entry is roughly zero before costs, so what the grid measures is what the bracket subtracts from zero.
That is the point. This article does not tell you which setup to trade. It tells you what every setup is fighting before its edge shows up.
The rule
- One long per cash session, at the open of a randomly chosen minute, 3,093 sessions.
- A stop at N ticks below the entry, a target at M ticks above it.
- N and M each drawn from 2, 4, 8, 12, 16, 24, 32 and 40 ticks. Every combination, 64 cells.
- Position held at most 120 minutes, then closed at the market.
- If one minute bar contains both the stop and the target, the stop is taken.
- $29.50 per round trip out of every trade in every cell.
Identical entries in all 64 cells. Only the two distances move.
How far a random ES long goes the wrong way
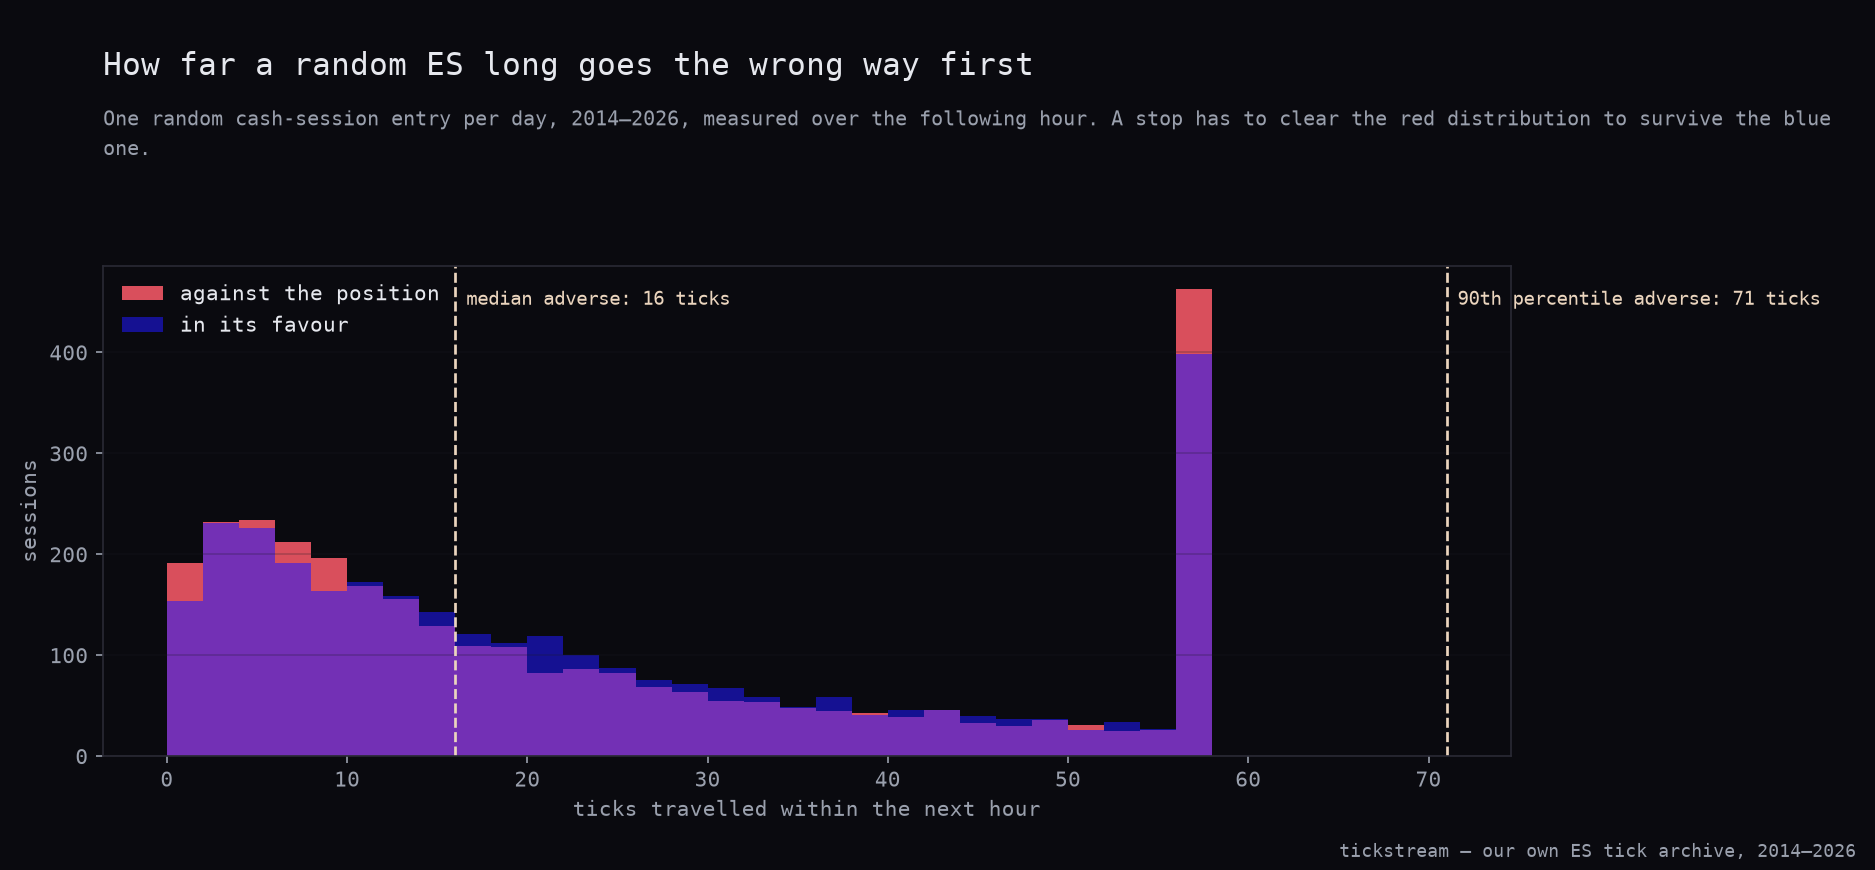
Before any of the grid, this is the part a reader can use tomorrow. For each entry we measured the worst excursion against the position and the best excursion in its favour over the following hour.
| Over the next hour | Against the position | In its favour |
|---|---|---|
| Median | 16.0 ticks | 17.0 ticks |
| 75th percentile | 37.0 ticks | 36.0 ticks |
| 90th percentile | 71.0 ticks | 64.0 ticks |
| 99th percentile | 193.1 ticks | — |
Two things fall straight out of that table.
A four-tick stop is not a stop. 86.3% of entries traded at least 4 ticks against the entry price at some point in the next hour. Six entries in seven. A stop at that distance is not filtering bad trades from good ones, because it fires on nearly all of them; it is an exit that triggers on ordinary noise and charges you the round trip for the privilege. At 16 ticks the share is still 50.9%, so even a stop at the median adverse excursion is a coin flip on its own terms.
The asymmetry people hope for is not there. The adverse and favourable columns in the table above are almost the same shape at every percentile. Price travels about as far one way as the other over an hour, which is what a near-martingale looks like when you measure it. So there is no stop distance at which the trade is structurally more likely to reach the target first. You cannot choose your way to a favourable bracket. You can only choose how the same distribution gets converted into fills.
The chart below is those two distributions on the same axis, clipped at 58 ticks, with the median and the 90th percentile of the adverse side marked.
The grid
Sixty-four cells, same entries, same costs. 0 of 64 are positive. Best −$13.12, worst −$40.61, median −$23.79.
The best cell is stop 40 / target 24, at −$13.12 a trade with t = −2.27. It is the least-bad cell in a grid of losers, and worth naming only because of where it sits, at one end of a U.
Here are four of the eight stop rows, across all eight targets, in average P&L per trade.
| Stop ↓ / Target → | 2 | 4 | 8 | 12 | 16 | 24 | 32 | 40 |
|---|---|---|---|---|---|---|---|---|
| 2 ticks | −$35.28 | −$30.11 | −$24.17 | −$20.69 | −$18.24 | −$16.18 | −$14.26 | −$15.40 |
| 8 ticks | −$40.23 | −$34.20 | −$29.11 | −$26.32 | −$25.45 | −$23.76 | −$21.69 | −$22.85 |
| 16 ticks | −$39.93 | −$34.00 | −$29.45 | −$25.64 | −$23.81 | −$21.57 | −$20.29 | −$20.79 |
| 40 ticks | −$37.19 | −$32.11 | −$27.19 | −$19.55 | −$15.76 | −$13.12 | −$14.83 | −$13.92 |
The full 64-cell heatmap is below, with every cell’s average printed in it. The scale is sequential because there is nothing positive to diverge from: dark is worst, pale is least bad.
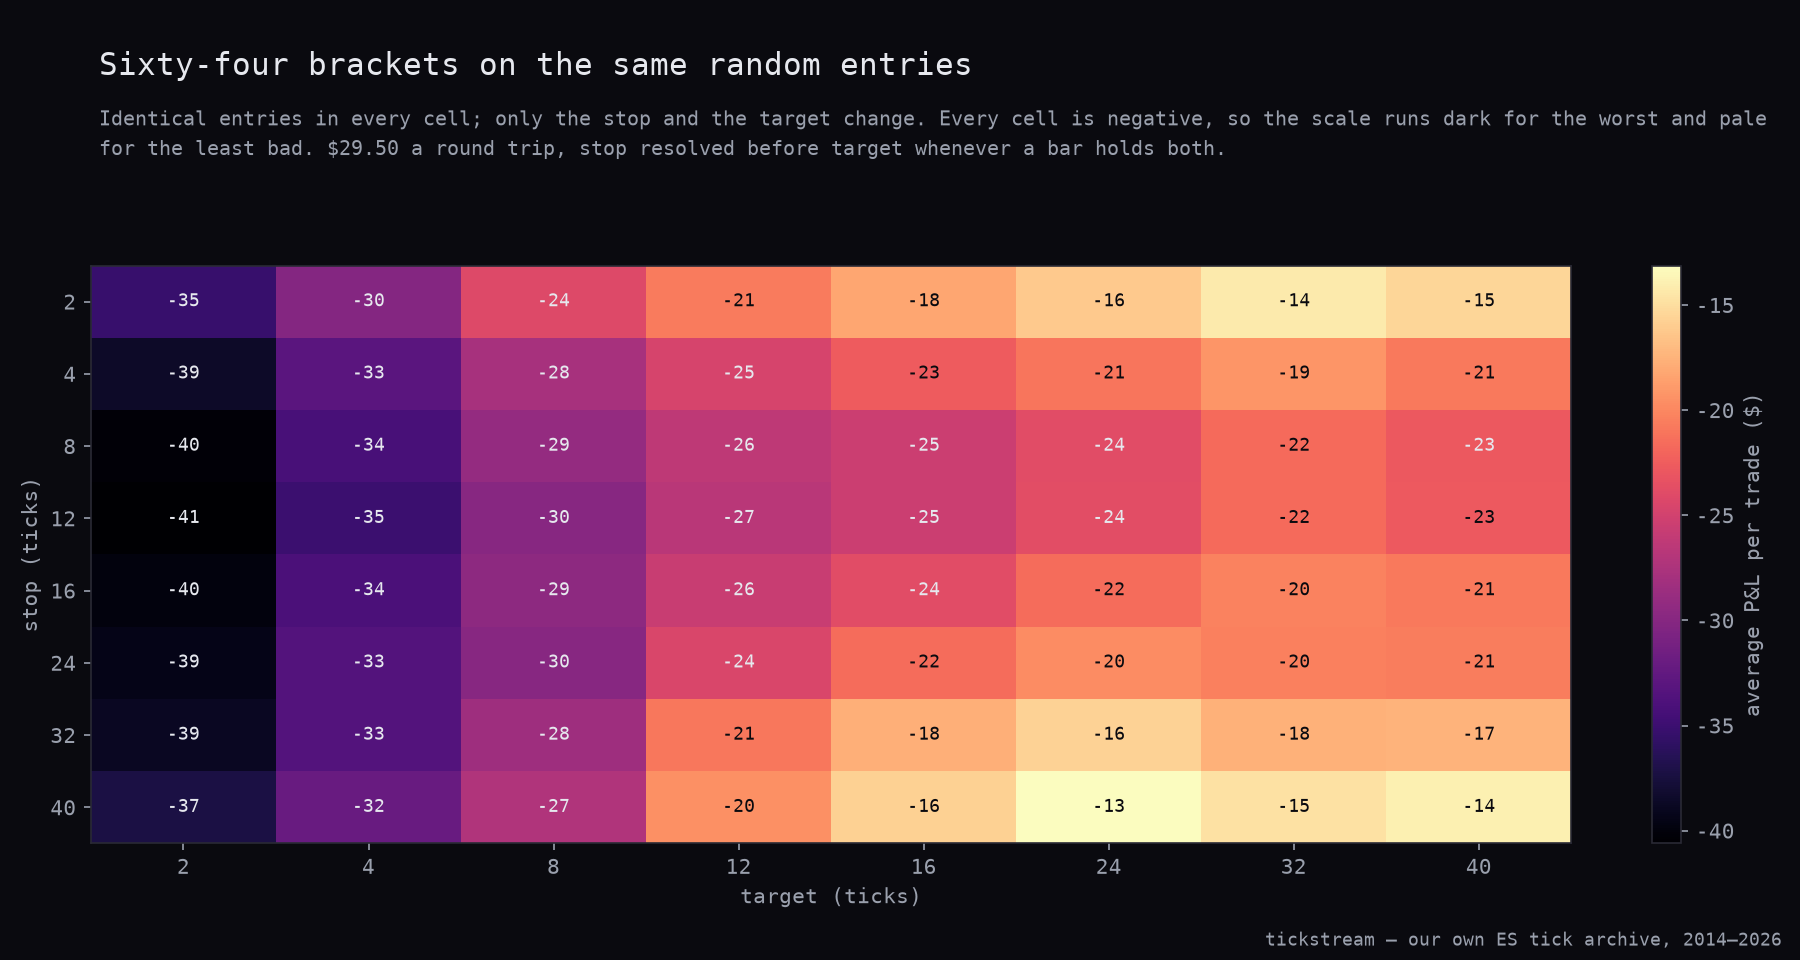
The shape is the finding, and the shape is a U. The expensive part of the grid is the middle. The 2-tick stop row averages −$21.79 a trade and the 40-tick row −$21.71, eight cents apart at the two ends. Every one of the six rows between them is worse, and the 12-tick row is the worst of the eight at −$28.22. The best cells split the same way: stop 40 / target 24 leads at −$13.12, and the third-best cell in the whole grid is stop 2 / target 32 at −$14.26.
The two ends get there by opposite routes. A 2-tick stop fires on nearly everything, since 86.3% of entries trade at least 4 ticks against the entry, but each firing costs 2 ticks plus the round trip and no more. A 40-tick stop sits out past the 75th percentile of adverse excursion, so it rarely fires and the outcome is decided by where price went rather than by the noise on the way. The middle rows pay both bills. A 12-tick stop is wide enough that every hit costs 12 ticks, and still inside the 16-tick median adverse excursion, so it keeps getting hit. Neither end is managing risk better than the other. They are cheaper ways of being wrong than the distances in between.
The null
The baseline is the same entries with no bracket at all: buy, hold to the session close, pay the same commission once.
| Hold to the close | |
|---|---|
| Trades | 3,093 |
| Win rate | 51.1% |
| Average | −$8.36 |
| Total | −$25,843.50 |
| Profit factor | 0.975 |
| Sharpe | −0.12 |
| t | −0.40 |
| p | 0.6857 |
Cells beating it: 0 of 64. The best bracket in the grid is worse than doing nothing.
The honest qualifier belongs next to that sentence. Holding to the close is itself slightly negative, at −$8.36 a trade. So the comparison is between a small loss and a larger one, not between a loss and a profit. At t = −0.40 and p = 0.6857 the hold-to-close result is statistically indistinguishable from zero, which is exactly what a random entry should produce: the $8.36 is the round trip and the drift working against each other, and nothing else.
Nothing in this article makes money. That is the correct outcome. If a random entry had produced a profitable bracket, the finding would have been a bug in the fill logic.
What this is not saying
This is not an argument against stops.
A stop does a job the grid cannot score: it bounds the worst trade. The worst single outcome in the stop-40 rows is −$529.50, and in the hold-to-close baseline it is −$7,754.50. If you are sized such that one bad session can end the account, that difference is the only number on the page that matters, and no expectancy calculation overrides it.
What the grid says is narrower and harder to argue with. A stop cannot create an edge. Once the entry carries no information, every tick of the bracket is a cost decision, not a risk-management one — it changes which part of the same distribution you get paid on, and it charges you for the change.
It also follows that this grid is not a lookup table. A setup with a real edge changes the entry distribution, and a different distribution has a different best cell. The right way to read the numbers here is as the surface a strategy has to climb out of: this is what the bracket costs when the entry adds nothing, so anything a strategy earns has to clear that first.
Where this sits in the series
This is the machinery underneath two earlier results.
The three-setups article found win rates of 77.0%, 57.7% and 72.9% on setups that all lost money. The wickless candle study was the extreme version: 91.1% of trades reached their target and 16.5% of them made money.
Both looked like anomalies at the time. They are not. Read down a column of the grid above, holding the target fixed and widening the stop, and the win rate marches while the money stays negative throughout. In the 4-tick target column it climbs from 32.5% with a 2-tick stop to 87.7% with a 40-tick one, and that last cell loses $32.11 a trade.
The 2-tick target column is the same point at its limit. All eight of its cells win 0.0% of the time, because a 2-tick target grosses $25.00 against $29.50 of cost, so a trade can reach its target and still book a loss. Pick the bracket and you have picked the win rate. The two are the same choice, and the P&L is settled somewhere else entirely.
What we changed
Nothing in the book. No sleeve was rebracketed on the strength of a random-entry grid, and it would be a mistake to rebracket one: our sleeves have entry information, and this test deliberately has none.
What changed is a check. Any new sleeve whose stop sits inside the 16-tick median adverse excursion now has to justify it explicitly, because we know what that distance does to a trade with no edge. It is not a veto. It is a question with a number attached.
Our ES tick archive, minute bars and trade prints back to 2014, is in the historical data packages.
Methodology: ES cash-session minute bars from our own tick archive, 3 January 2014 to 9 September 2026, 3,093 sessions. One long per session at the open of a randomly chosen minute; excursions measured over the following 60 minutes; bracketed positions held at most 120 minutes and then closed at the market. Stops and targets from the set 2, 4, 8, 12, 16, 24, 32, 40 ticks, all 64 combinations on identical entries. When a single bar contains both the stop and the target, the stop is taken. One contract, $4.50 commission plus two ticks of slippage per round trip, $29.50 on ES; one ES tick is $12.50. Sharpe is annualised on the trade rate.
Frequently asked questions
How far does an ES trade normally go against you before it works?
The median random long in our sample takes 16.0 ticks of heat within the following hour. The 75th percentile is 37.0 ticks, the 90th is 71.0 and the 99th is 193.1. Those are the numbers a stop has to clear, and they are measured on 3,093 cash sessions rather than estimated from an ATR multiple.
Is a 4-tick stop too tight on ES?
It is not really a stop. 86.3% of our random entries traded at least 4 ticks against the entry price at some point in the next hour, so a 4-tick stop fires on more than six entries in seven regardless of what happens afterwards. At 16 ticks the figure is still 50.9%, which is a coin flip.
Which stop and target combination did best?
Stop 40 / target 24, at −$13.12 per trade with t = −2.27. It is the least-bad of 64 cells, not a winner. The worst cell averaged −$40.61 and the median across the grid was −$23.79, with 0 of 64 cells finishing positive.
Is a tight stop or a wide stop cheaper on ES?
Neither end is the expensive part; the middle is. The 2-tick stop row averages −$21.79 a trade and the 40-tick row −$21.71, eight cents apart, while every row between them is worse and the 12-tick row is worst at −$28.22. Stop 40 beats stop 2 in only four of the eight targets, and the grid's third-best cell is stop 2 / target 32 at −$14.26. Inside the stop-2 row the best target is 32 at −$14.26 and the worst is 2 at −$35.28.
What is the baseline these brackets have to beat?
Holding the same 3,093 entries to the session close with no stop and no target. That loses $8.36 a trade, $25,843.50 in total, with a 51.1% win rate, a profit factor of 0.975 and t = −0.40 at p = 0.6857. It is statistically indistinguishable from zero, and 0 of the 64 bracketed cells beat it.