Three ES Setups, Win Rates of 77%, 73% and 58%. All Six Versions Lose.
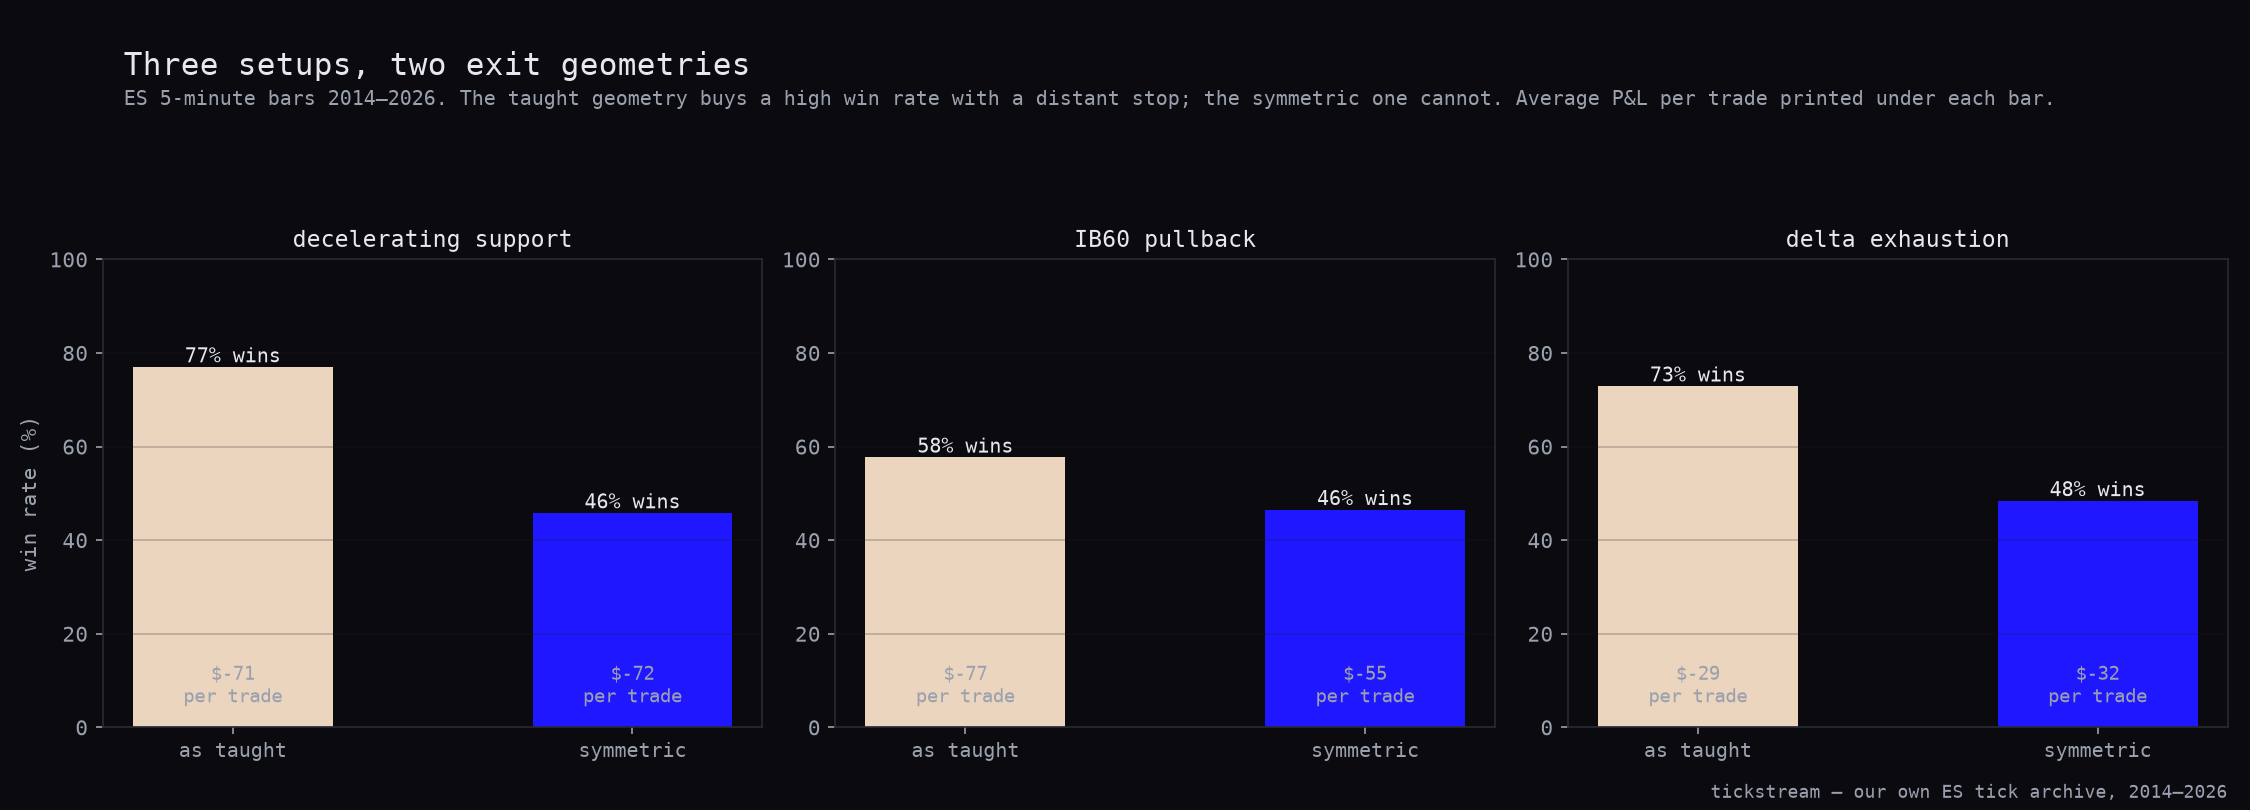
We took three popular reaction setups — decelerating support, the first-hour pullback, and delta exhaustion — and scored each one twice on 868,567 five-minute ES bars: once with the exit geometry it is taught with, once with a symmetric bracket. Every one of the six cells loses money. The taught versions post win rates of 77.0%, 57.7% and 72.9% while losing $71.14, $76.98 and $29.30 a trade. Switching to a symmetric bracket drops those win rates to 45.8%, 46.5% and 48.4% and, for two of the three, leaves the expectancy almost exactly where it was.
We tested three setups that are taught as turning-point trades on the S&P: decelerating support, the first-hour pullback, and delta exhaustion. Each was scored twice on the same signals — once with the exit geometry it is sold with, once with a symmetric bracket that cannot manufacture a win rate. All six cells lose money, and the taught versions post win rates of 77.0%, 57.7% and 72.9% while doing it.
That is the article. The win rates are real, they are also worthless, and the reason is arithmetic that a reader can check without a backtest.
The three rules
Each one is stated precisely enough to reimplement. All run on 5-minute ES bars with ATR(14).
Decelerating support. Take the lowest low of the trailing 31 bars as the level. Count every bar in that window whose low sits within 0.15 ATR of it. Require at least three such touches, and require the last three to get progressively shallower — each push penetrates the zone less deeply than the one before. Buy at the close of the scanning bar on which that third, shallower push is confirmed, not at the close of the touch bar itself. One position at a time.
IB60 pullback. The first twelve 5-minute bars of the cash session build the initial balance. The first later bar to trade beyond either edge is the break, filled at the worse of the edge or that bar’s open. The trade is the first pullback that returns to the broken edge, taken in the direction of the break. Risk is measured in units of the first-hour range, not ATR.
Delta exhaustion. A bar that makes a 60-bar high while printing positive delta, or a 60-bar low while printing negative delta, and whose absolute delta sits in the top 2% of the trailing 500 bars. Fade it at the close.
The delta in that third rule is the exchange’s own aggressor flag, carried on every print in our tick archive. It is not a quote-rule reconstruction, so the exhaustion signal is measured on real one-sidedness. That distinction matters here: a reader can dismiss a failed order-flow test as bad data, and this one is not.
Each setup was then run through two brackets. As taught is a 0.5-unit target against a 2-unit stop. Symmetric is one unit each way. Nothing else changed — same signals, same bars, same fills.
The table
Both geometries, all ten rows, 482 to 2,941 trades apiece.
| Decelerating support | As taught (0.5/2) | Symmetric (1/1) |
|---|---|---|
| Trades | 482 | 441 |
| Win rate | 77.0% | 45.8% |
| Average | −$71.14 | −$72.42 |
| Median | +$96.84 | −$209.86 |
| Total | −$34,289.09 | −$31,938.07 |
| Profit factor | 0.625 | 0.684 |
| Max drawdown | $34,709.45 | $32,767.39 |
| Sharpe | −0.91 | −0.95 |
| t | −3.23 | −3.39 |
| Exits | 371 target / 110 stop / 1 timeout | 201 target / 238 stop / 2 timeout |
| IB60 pullback | As taught (0.5/2) | Symmetric (1/1) |
|---|---|---|
| Trades | 2,914 | 2,914 |
| Win rate | 57.7% | 46.5% |
| Average | −$76.98 | −$54.98 |
| Median | +$117.38 | −$54.50 |
| Total | −$224,331.75 | −$160,200.50 |
| Profit factor | 0.760 | 0.843 |
| Max drawdown | $224,662.00 | $160,429.00 |
| Sharpe | −1.34 | −0.94 |
| t | −4.79 | −3.34 |
| Exits | 1,443 target / 144 stop / 1,327 timeout | 638 target / 767 stop / 1,509 timeout |
| Delta exhaustion | As taught (0.5/2) | Symmetric (1/1) |
|---|---|---|
| Trades | 2,941 | 2,924 |
| Win rate | 72.9% | 48.4% |
| Average | −$29.30 | −$31.79 |
| Median | +$29.43 | −$74.14 |
| Total | −$86,178.25 | −$92,952.64 |
| Profit factor | 0.653 | 0.720 |
| Max drawdown | $86,858.25 | $94,008.50 |
| Sharpe | −1.76 | −1.94 |
| t | −6.27 | −6.92 |
| Exits | 2,326 target / 585 stop / 30 timeout | 1,415 target / 1,490 stop / 19 timeout |
Every column in all three tables is negative. Decelerating support wins three trades in four as taught and still loses money. Delta exhaustion reaches its target four times for every stop it takes and still loses money. IB60 is the worst of the three per trade. Switching all of them to a symmetric bracket cuts every win rate to the mid-forties and changes the sign of nothing.
The chart below prints both win rates for each setup side by side, with the average P&L per trade underneath each bar. The gold bar is the taught geometry, the blue one is symmetric.
Where the win rate comes from
A 0.5-unit target against a 2-unit stop wins one for every four it risks. Break-even needs four wins for every loss, so 80% — before a cent of cost comes out.
Decelerating support wins 77.0% of the time. That is below the bar it has to clear, which is why a setup that wins three out of four still loses $71.14 a trade.
So the win rate is not evidence of anything. It is a restatement of the bracket. Any reader can compute the required win rate from the two distances alone, in one division, with no backtest and no data. And it runs the other way too: a symmetric bracket needs 50%, a 2:1 target needs 33%, and a quarter-unit target against a three-unit stop needs 92%. A win rate quoted without its bracket carries no information at all. It is not a weak claim or an unverified claim — it is not a claim.
That is the whole reason we scored every setup twice. The taught geometry does not test the signal; it tests the geometry. The symmetric one is the control, and it is the only column here where the win rate says something about whether these levels actually mark turns.
The ordering barely moves
Here is the part that makes this more than a null. If the exit geometry were doing real work, changing it would reshuffle which setup is best. It does not.
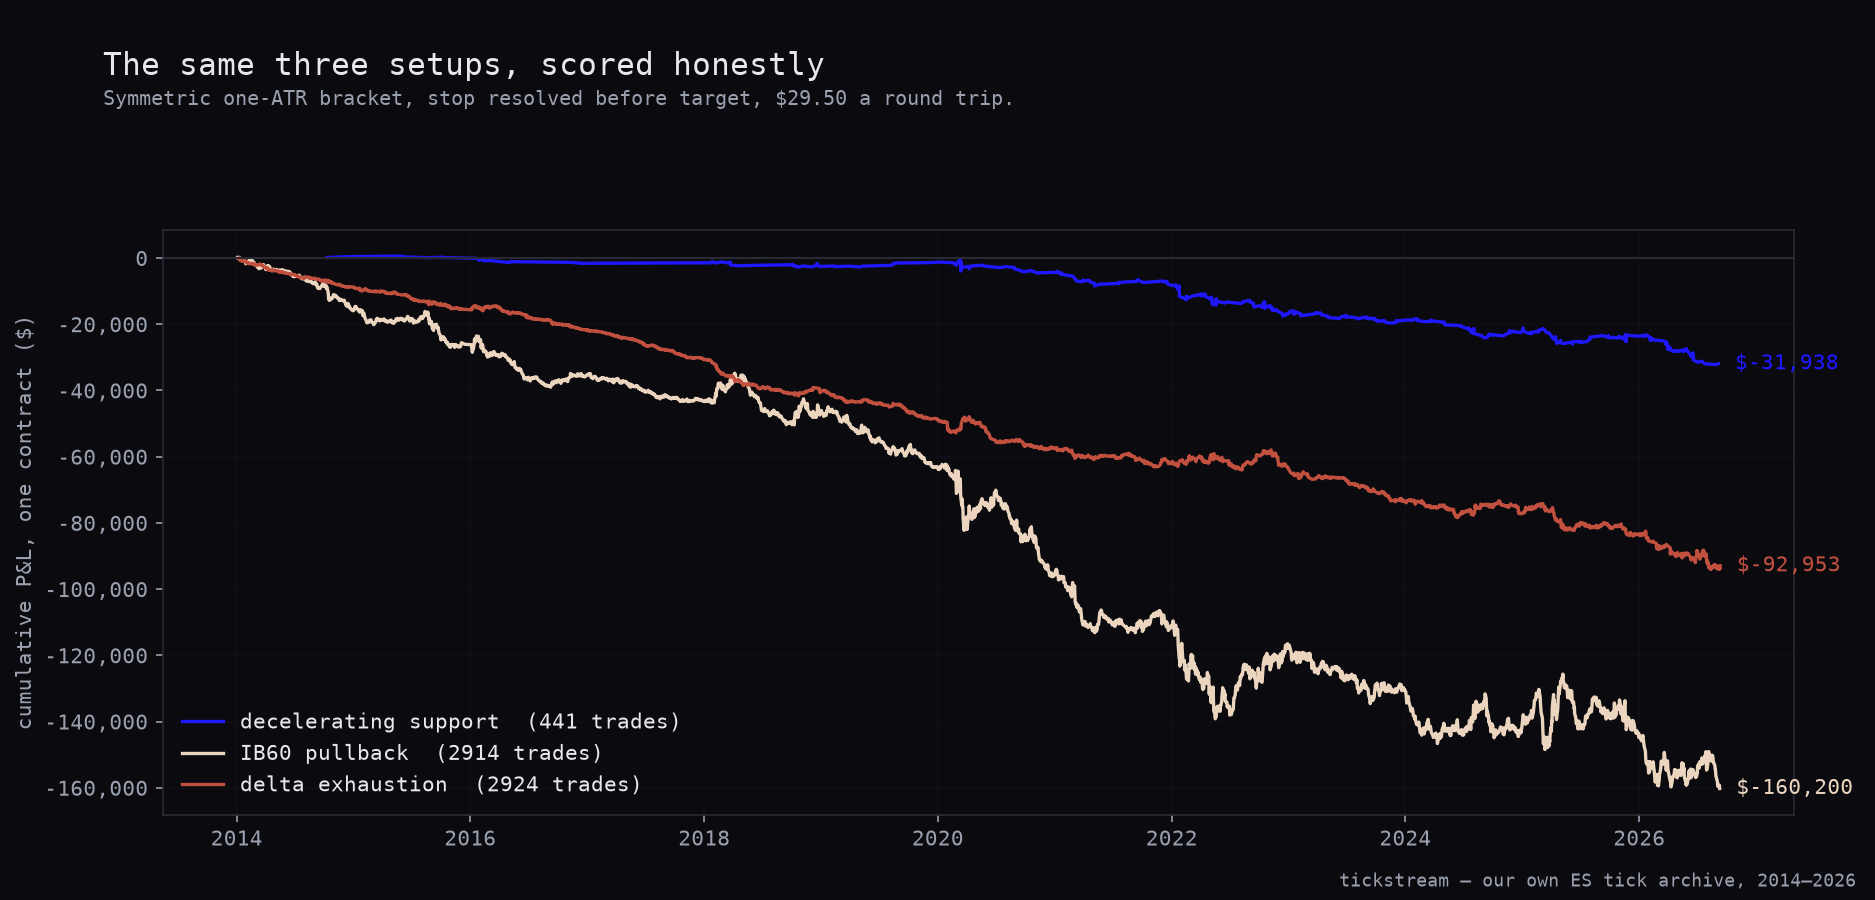
By total dollars the ranking is identical in both columns. IB60 loses the most either way, −$224,331.75 as taught and −$160,200.50 symmetric. Delta exhaustion sits in the middle at −$86,178.25 and −$92,952.64. Decelerating support is the smallest loser in both, on far fewer trades.
Per trade, delta exhaustion is close to unmoved: −$29.30 as taught against −$31.79 symmetric. The bracket moved its win rate by 24.5 points and its expectancy by $2.49. Decelerating support behaves the same way, −$71.14 against −$72.42, a shift of $1.28 on a 31.2-point swing in win rate. Only IB60 reacts at all, improving from −$76.98 to −$54.98, and it is still the worst of the three in dollar terms after the improvement.
That is the cleanest available statement of what a win rate measures. It measures the bracket. It does not measure the signal, and the expectancy — which does measure the signal — is roughly indifferent to which bracket you wrap around it.
Below is the same three setups with the honest geometry only: symmetric one-unit bracket, stop resolved before target inside any bar that touches both, $29.50 out per round trip. Three lines, all down.
The fourth time this series has hit it
This is the fourth ES article where a high win rate showed up attached to a losing strategy, and by now it is the pattern rather than the exception.
The wickless candle was the extreme case: 91.1% of trades reached their target and the strategy still lost money, because the target was often worth less than the round trip. The VWAP bands with CVD confirmation was the quiet version — a 52.4% win rate that lost anyway, because the bracket behind it needed more than that.
Both failures have the same shape as these three. In every case the win rate was a fact about the exit and not about the entry. Since the wickless study we have treated a win rate as unreadable without its bracket, which is why the bracket is stated next to every win rate we print.
Each of these three setups was tested on NQ before it reached this run, and the ES numbers here can be read against those verdicts directly: decelerating support, the IB60 first-hour pullback, and footprint order-flow exhaustion.
What we changed
Nothing to deploy. None of these three was in the book, none of them is going in, and no sleeve had to be adjusted.
The useful output is a rule, and it costs nothing to apply: quote the bracket with the win rate, or do not quote the win rate. If a strategy is sold to you at 77% and the target-to-stop ratio is not on the same page, the number is unfalsifiable. If the ratio is on the page, you can do the division yourself and decide whether the claimed win rate even clears break-even, before you ask anyone for a track record.
Our own ES tick archive, with the exchange aggressor flag on every print back to 2014, is in the historical data packages.
Methodology: ES continuous front-month, 5-minute bars resampled from our own minute archive, 868,567 bars from 2 January 2014 to 10 September 2026. Decelerating support and the IB60 pullback run on the cash session, 09:30–15:55 ET; delta exhaustion runs on all bars, since exhaustion prints outside the cash session too. Levels and stops in ATR(14) multiples except IB60, which uses the first-hour range as its unit. Maximum hold 48 bars, one position at a time. Exits: 0.5 target against 2.0 stop for the taught geometry, 1.0 both ways for the symmetric one; when a single bar touches both, the stop is taken. One contract, $4.50 commission plus two ticks of slippage per round trip, $29.50 on ES. Delta is the exchange aggressor flag summed per bar, not a quote-rule estimate. Sharpe is annualised on the trade rate over the 12.7-year window.
Frequently asked questions
Does a 77% win rate mean a strategy is profitable?
No. Our decelerating-support test won 77.0% of its 482 trades and still lost $71.14 per trade, $34,289.09 in total. The reason is the bracket it is taught with: a 0.5-ATR target against a 2-ATR stop pays one unit for every four risked, so it needs 80% wins just to break even before costs. At 77.0% it is already under water on arithmetic alone.
What happens to these setups with a symmetric stop and target?
The win rates collapse and the money does not move. Decelerating support goes from 77.0% to 45.8% wins, delta exhaustion from 72.9% to 48.4%, and the first-hour pullback from 57.7% to 46.5%. Expectancy barely reacts: delta exhaustion loses $29.30 a trade as taught and $31.79 a trade symmetric.
Which of the three loses the most?
The IB60 first-hour pullback, on both counts of total dollars. It gave up $224,331.75 across 2,914 trades as taught and $160,200.50 with the symmetric bracket. Per trade as taught it is the worst of the three at −$76.98, against −$71.14 for decelerating support and −$29.30 for delta exhaustion.
Is the delta exhaustion signal built on real order flow?
Yes. The delta comes from the exchange's own aggressor flag on every print in our ES tick archive, not from a quote-rule reconstruction, so the one-sidedness is measured rather than inferred. It still fails: 2,941 trades, a Sharpe of −1.76 and t = −6.27, with 2,326 target exits against only 585 stops.
What data and costs are behind these numbers?
868,567 ES five-minute bars from 2 January 2014 to 10 September 2026, built from our own trade prints. One contract, $4.50 commission plus two ticks of slippage per round trip, which is $29.50 on ES, and a bar that touches both stop and target is always scored as the stop.