Dealer Gamma Regime: Why Negative Gamma Doubles the Next Day's Move
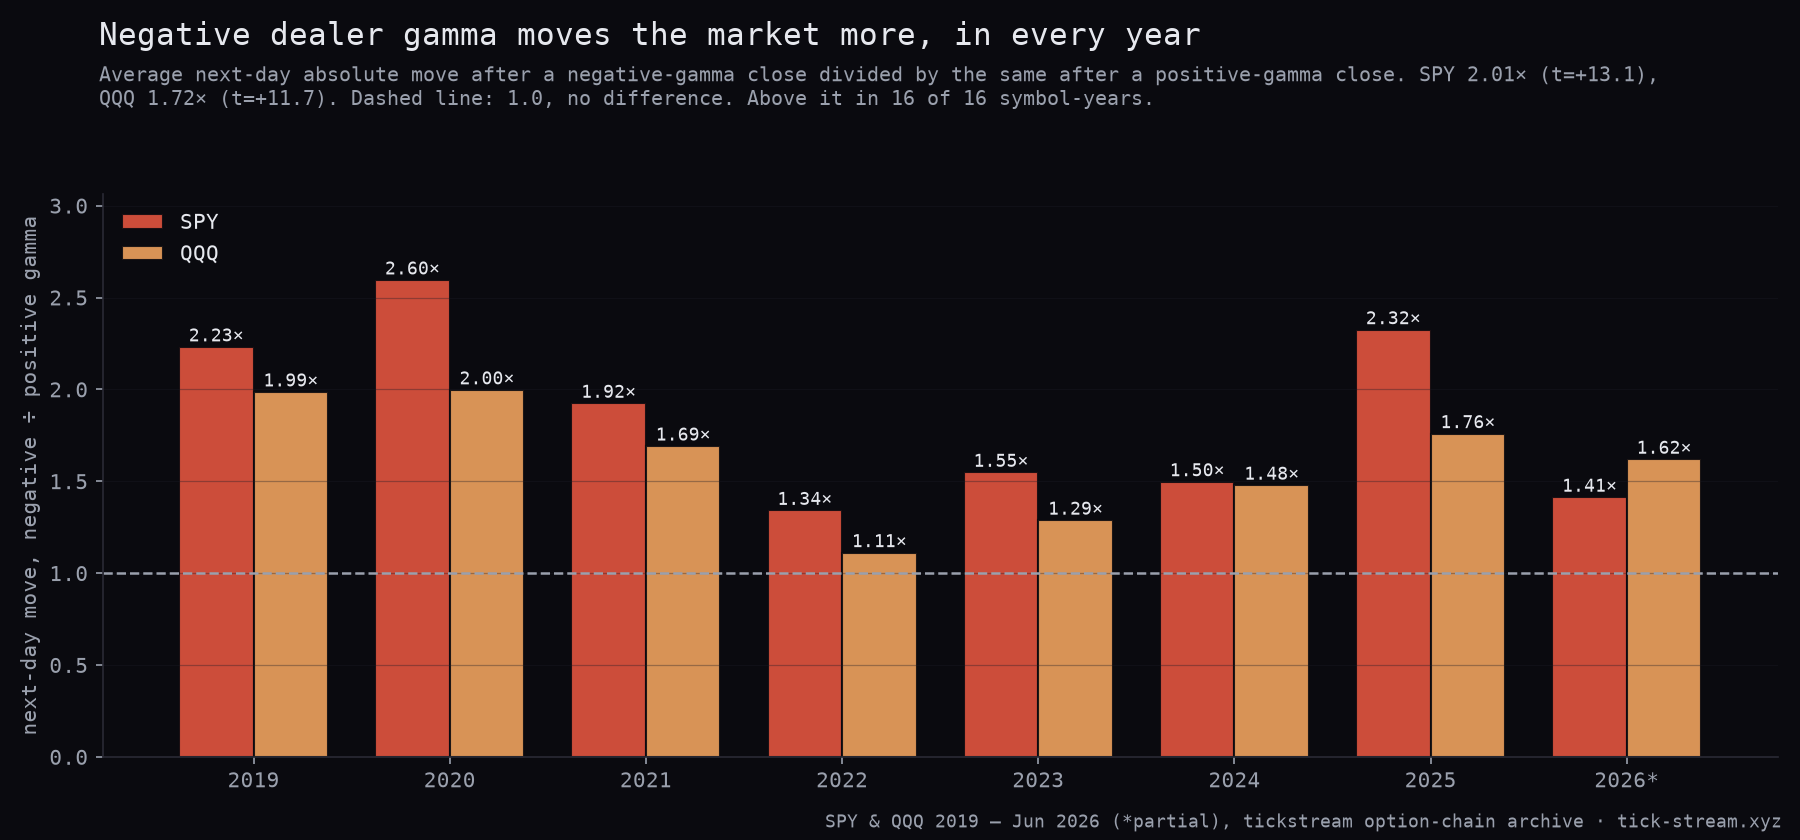
The volatility-regime panel tells you whether option dealers are long or short gamma, and therefore whether their hedging will damp the tape or push it. On seven years of SPY and QQQ it is the most stable effect we measure: about twice the next-day range under negative gamma, in every single year. What it does not tell you is which way.
The volatility-regime panel answers one question before the open: are option dealers going to damp today’s moves, or push them further? It reads the net gamma the dealers carry across the whole option chain and labels the state in two words, damping or amplifying. Everything else on the gamma side of the terminal, the walls, the flip line, the expected-move bands, is easier to read once you know which of the two you are in.
This page explains what the regime is, why it works mechanically, and what seven years of our own option-chain archive say it is good for. The short version: it is the most reliable thing we measure in options data, and it is reliable about one thing only, how far.
What the regime is
A dealer who sells an option hedges it with the underlying. How much they have to trade as price moves depends on the option’s gamma. Summed across every strike and expiry, that gives the dealers’ net gamma exposure, the number the terminal prints as net GEX.
- Positive gamma (damping). Dealers are long gamma. When price rises they sell into it to stay hedged, and when it falls they buy. Their hedging leans against the move, so ranges compress and price tends to settle between the big strikes.
- Negative gamma (amplifying). Dealers are short gamma. When price rises they have to buy, and when it falls they have to sell. Their hedging adds to the move, so it carries further than the flow that started it.
For ES and NQ the terminal computes the surface from SPY and QQQ options, where the hedging open interest actually sits, and maps it onto the futures through the live price ratio.
What our data says: about twice the range, every year
We took every trading day from January 2019 to June 2026 in our option-chain archive, 1,870 days each for SPY and QQQ, classified each close by the sign of net gamma, and measured the absolute move to the next close.
| Negative gamma | Positive gamma | Ratio | |
|---|---|---|---|
| SPY, average next-day move | 1.09% | 0.55% | 2.01× (t = 13.1) |
| QQQ, average next-day move | 1.34% | 0.78% | 1.72× (t = 11.7) |
| SPY, days moving more than 1.5% | 24% | 5% | 4.8× |
| QQQ, days moving more than 1.5% | 34% | 14% | 2.5× |
The part that makes this worth building a panel around is the consistency. The ratio was above 1.0 in all 16 symbol-years, from 1.11× on QQQ in 2022 to 2.60× on SPY in 2020. Most effects in market data come and go with the regime of the year; this one did not break once in seven years, through a crash, a bear market and two bull runs.
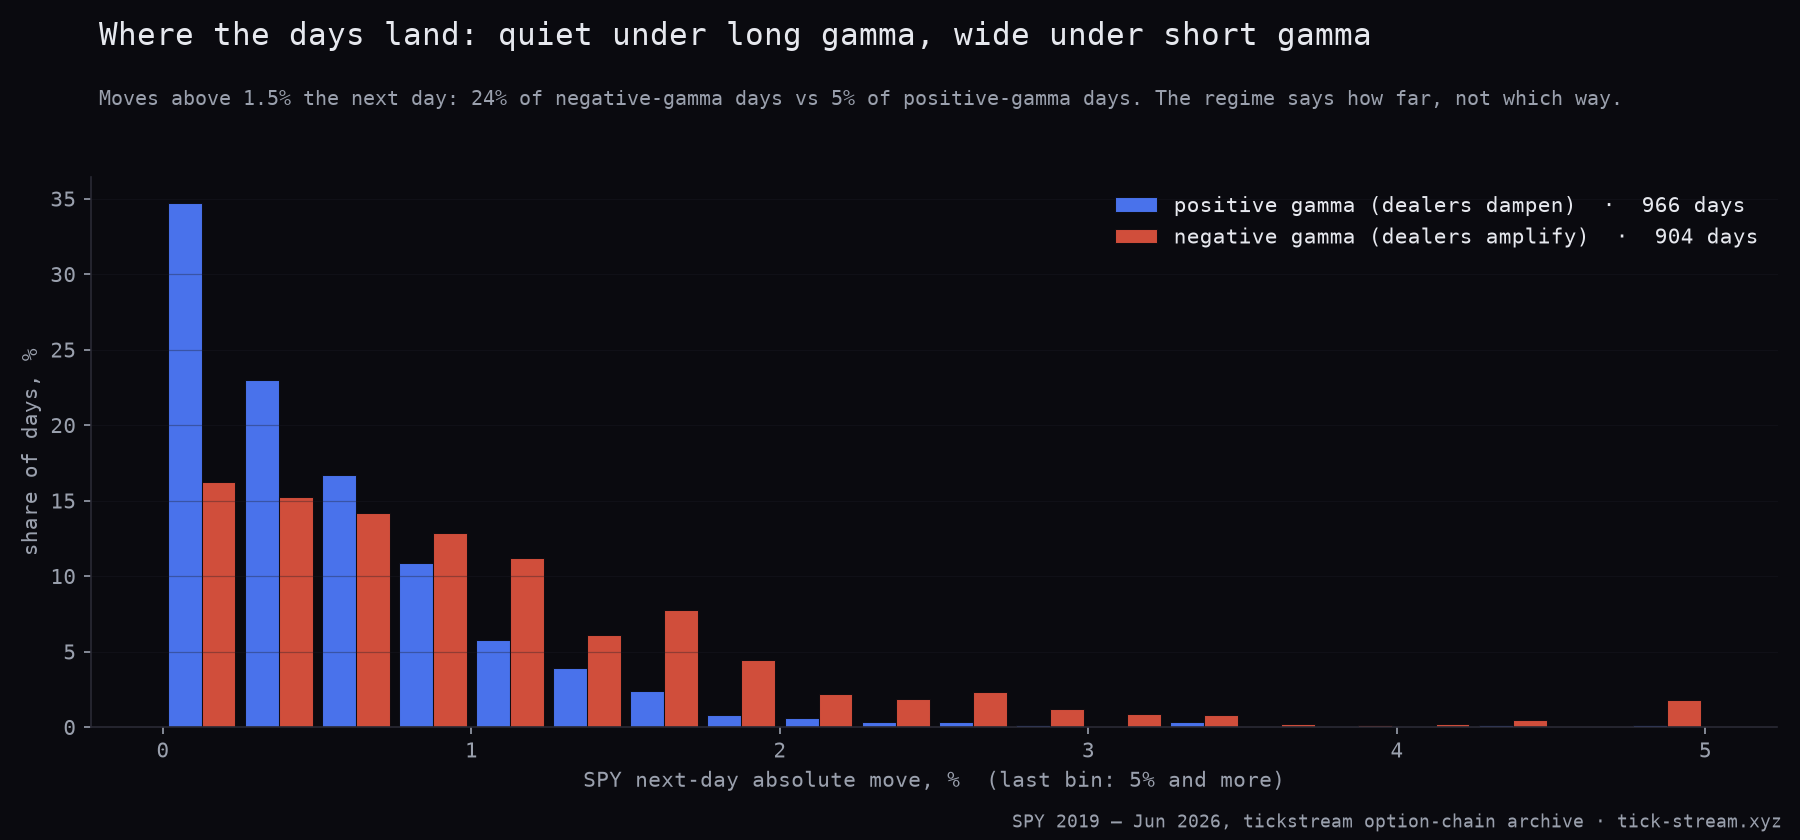
The distribution shows where the difference comes from. Under positive gamma, 58% of SPY days moved less than half a percent the next day. Under negative gamma that share falls to 31%, and the right tail, the 2%, 3% and 5% days, is almost entirely negative-gamma territory.
What it does not tell you: direction
The obvious next thought is that negative gamma must mean down. It does not. After a negative-gamma close, 54% of SPY days closed higher the next day; after a positive-gamma close, 57% did. QQQ: 54% against 59%. The average signed next-day return was slightly positive in both regimes.
That is why the panel is labelled as a magnitude reading. It tells you how hard the tape is likely to swing, and it deliberately says nothing about which way to lean. A regime flag that looked directional would be selling you something the data does not support.
How to read it in the terminal
- Check it before the open. The regime is computed from the chain as it stands, and the state at the close carries the next day’s effect in our data. It updates through the session as the chain moves.
- Size to it. The same stop distance is a different bet in the two regimes. Twice the average range means a stop that survives a positive-gamma day is routinely run in a negative-gamma one.
- Pick the trade type to it. Fading extremes back towards the big strikes fits damping. Following a break fits amplifying, and fading one is how the negative-gamma right tail hurts.
- Watch the flip. The zero-gamma flip line on the chart is where the regime would change sign. Price trading through it is the moment the state changes, not a price target.
The candles carry the state too: negative gamma tints the chart, so you do not have to remember to look at a separate widget. The gamma walls, flip and levels sit underneath on the same screen.
Limits worth knowing
- Gamma walls are weaker than the regime. In the same dataset a call wall was broken 33.0% of the time against 33.3% for a random level at the same distance, which is no effect at all. The regime is a statistic about the whole chain; a single strike is not.
- The flip level is noisier than net GEX. When we filtered implausible flip values out of the history, the flip-based version of this study shrank to 1.25× on SPY and lost significance on QQQ. The sign of net GEX is the robust part.
- It is daily data. This study measures close-to-close. Intraday, the same regime shows up as roughly 40% more realised volatility in our session data, but the clean, seven-year number is the daily one.
For a worked example of what a long negative-gamma stretch looks like from the inside, see gamma squeeze explained, which follows SPY through three weeks under minus 16 billion of net gamma in March 2026.
Methodology: tickstream option-chain archive, SPY and QQQ end-of-day chains, 2 January 2019 to 16 June 2026, 1,870 trading days per symbol. Net gamma exposure summed over all strikes and expiries with dealer sign conventions; regime = sign of net GEX at the close. Next-day move = absolute close-to-close change of the underlying. Significance from a Welch t-test on the two samples. Direction check: share of positive next-day returns and mean signed return per regime.
Frequently asked questions
What does negative gamma mean for futures traders?
It means option dealers, in aggregate, are short gamma: as price rises they have to buy more to stay hedged, and as it falls they have to sell. Their hedging pushes in the direction of the move instead of leaning against it. On seven years of SPY and QQQ, a negative-gamma close preceded about twice the next-day range of a positive-gamma close. For ES and NQ the terminal computes the regime from SPY and QQQ options, where most of the hedging open interest sits.
Does negative gamma mean the market will fall?
No. The regime is a magnitude reading. In our data the share of up days after a negative-gamma close was 54% on SPY versus 57% after a positive-gamma close, and the average signed next-day return was slightly positive in both. Negative gamma tells you to expect a wider range and faster moves, in either direction.
How is the gamma regime calculated?
The terminal sums the gamma of every listed option on the underlying, weighted by open interest (or by today's volume on the volume lens), with the sign conventions of dealer positioning: customers are net long puts and short calls, so dealers carry the opposite. The sum at the current spot is net gamma exposure. Above zero is the damping regime, below zero the amplifying one. The zero-gamma flip is the price at which that sum would change sign.
Is the gamma regime a trading signal on its own?
Not a directional one. It is useful for sizing and for choosing the kind of trade: tighter targets and fading extremes suit the positive-gamma regime, wider stops and following momentum suit the negative one. Our own strategy that trades the regime, Riptide, runs as a public paper record rather than as a claim.
How often does the regime change?
Often enough that it matters to check it daily. Over 2019 to mid-2026 SPY closed in negative gamma on 904 days and in positive gamma on 966 days, so the market spends roughly half its time in each state, in stretches that last from a day to several weeks.