Gamma Levels: Call Wall, Put Wall, Flip and the Expected Move, Tested
The levels board prints six numbers read off the option chain: call wall, put wall, zero-gamma flip, expected move up and down, and net gamma. We rebuilt the call wall, the put wall and the expected move exactly as the terminal computes them on seven and a half years of QQQ and SPY. The expected move is priced about right; the walls are rarely reached and do not stop price when they are.
The levels board is the whole gamma picture reduced to six numbers: call wall, put wall, zero-gamma flip, expected move up, expected move down, and net gamma. They are read off the same chain the gamma profile is built from, for whichever lens the bar is set to, and they are the same values the API returns as JSON. There are no arrows next to them and no targets, on purpose.
The short version of what seven and a half years of our option-chain archive say: the expected move is an honest yardstick, and the walls are places to measure from, not floors or ceilings.
What the six numbers are
- Call wall. The strike within 6% of spot that carries the most positive dealer gamma. Dealers hedging there sell into strength and buy weakness, so it is where the chain leans hardest against a move.
- Put wall. The strike within 6% of spot with the most negative dealer gamma, the concentration of put hedging.
- Zero-gamma flip. The price at which net dealer gamma would change sign if spot moved there. Above it the chain damps moves, below it amplifies them.
- Expected move up and down. Spot plus and minus the at-the-money straddle on the nearest expiry.
- Net gamma. The sum of dealer gamma across the chain at the current price, in the selected lens. Its sign is the volatility regime.
For NQ and ES the chain is QQQ and SPY options, where the hedging open interest sits, mapped onto the future through the live price ratio.
How the terminal computes them
Each strike’s gamma is evaluated at that strike, with each contract’s own implied volatility, not with today’s spot-decayed greek. That answers “how much hedging happens if price trades there”, the question a level is meant to answer. Contracts with failed volatility fits are dropped. Calls count positive and puts negative, following the usual assumption that customers are long puts and short calls. The walls are the extreme strikes inside a ±6% window, with a little hysteresis so that two near-equal strikes cannot swap the title back and forth on noise.
The flip is root-found on the spot-parametrised net-gamma curve. The expected move is deliberately model-free: the mid of the call plus the mid of the put at the strike nearest spot, on the front expiry. For SPY and QQQ, which list an expiry nearly every day, the band on the board before the open is the straddle on the next session’s expiry.
What our data says: the expected move is priced about right
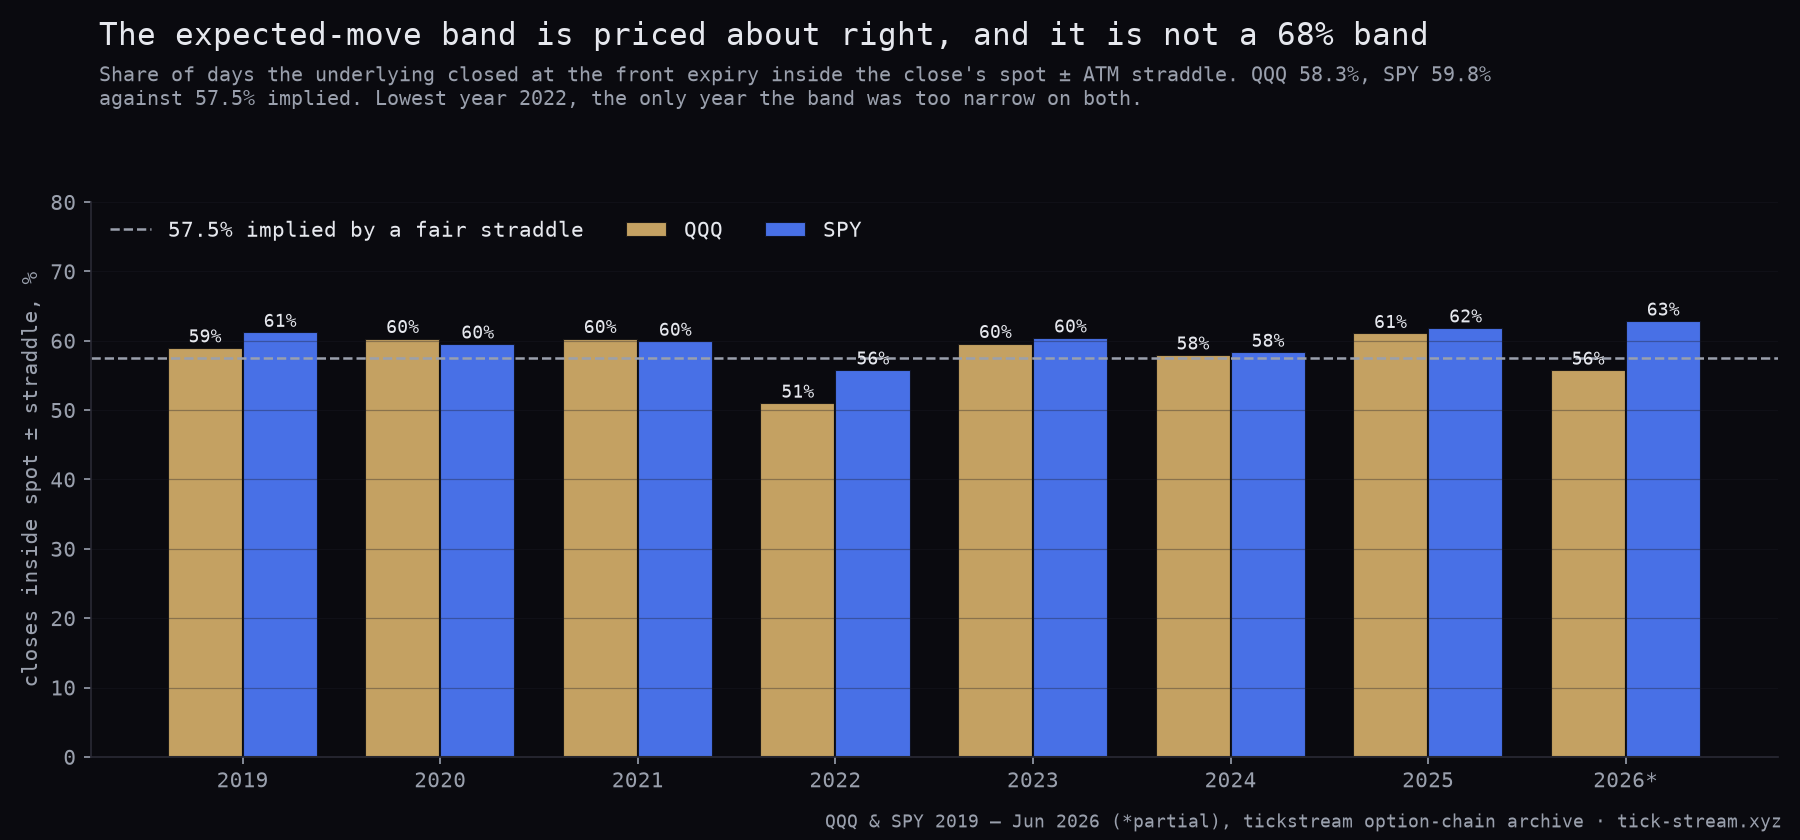
We rebuilt the band exactly that way on every close from January 2019 to June 2026: the front expiry’s at-the-money straddle at the close, the same-day expiry already gone. Then we checked where the underlying closed on that expiry. For about two-thirds of QQQ days and four-fifths of SPY days that is the next session; before daily expiries were listed it was up to a week.
The benchmark matters. A straddle prices the average absolute move, which under a normal distribution is about 0.8 standard deviations. A fairly priced band should therefore hold the close about 57.5% of the time, not 68%.
| QQQ | SPY | |
|---|---|---|
| Days | 1,870 | 1,869 |
| Average expected move | 1.32% | 0.90% |
| Average realised move to expiry | 1.28% | 0.87% |
| Realised ÷ expected | 0.96 | 0.97 |
| Close inside the band | 58.3% | 59.8% |
| Close beyond twice the band | 8.8% | 8.4% |
Overall the band was very slightly wide, as expected when option sellers collect a volatility premium, and close to fair. The one clear miss is 2022, the bear market: QQQ closed inside only 51.0% of the time and realised 1.08 times its expected move, SPY 55.8% and 1.04. That was the only year the market outran the options on both symbols.
Intraday, the edge is reachable rather than a boundary. On the 1,269 QQQ days with a next-day expiry, the session’s high touched the upper edge 37.6% of the time and the low touched the lower edge 33.7% of the time. On 69.5% of days one edge or the other was touched, yet over the same days 58.5% closed inside the band. The band is a guide to where the day settles, not a fence around its range.
The regime changes how much of the band gets used
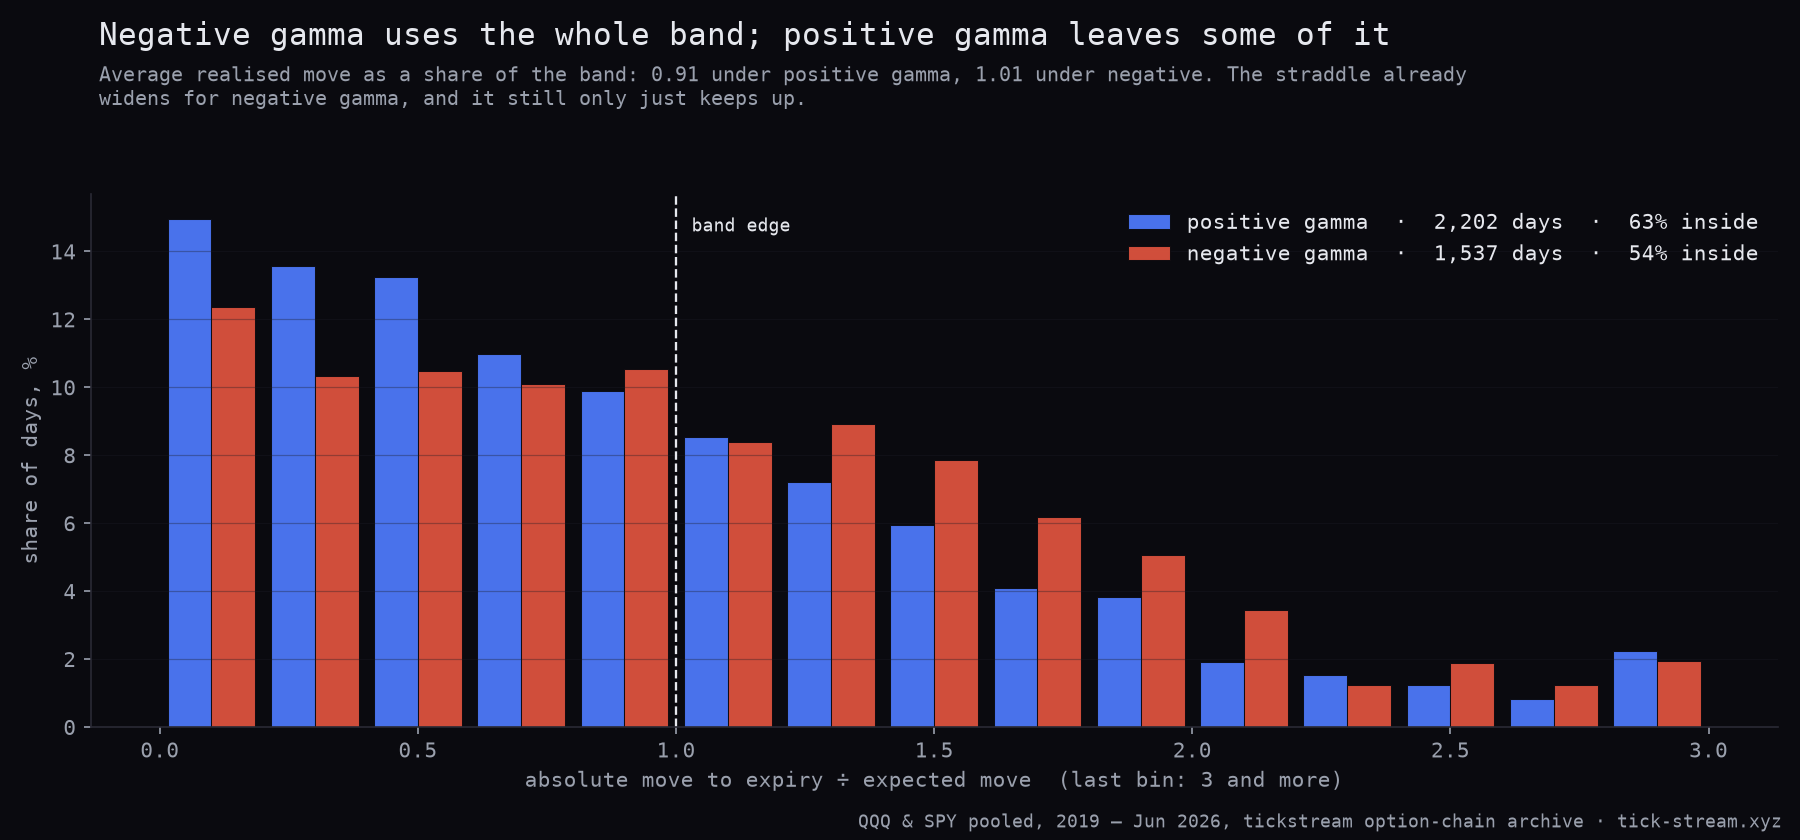
The straddle already knows about the gamma regime: under negative net gamma the average QQQ band was 1.66% wide against 1.08% under positive gamma. It still only just keeps up.
| QQQ and SPY pooled | Positive gamma | Negative gamma |
|---|---|---|
| Days | 2,202 | 1,537 |
| Close inside the band | 63% | 54% |
| Realised ÷ expected | 0.91 | 1.01 |
| QQQ days touching an edge (next-day expiry) | 65.7% | 74.6% |
Under positive gamma the market used about nine-tenths of the band it paid for. Under negative gamma it used all of it and more of the tail. In positive gamma the edges are a sensible outer bound for the close; in negative gamma they are a typical day, not an extreme one.
What the walls do: not much
With the terminal’s own wall definition, the call wall sat above QQQ on 96% of closes, a median 3.9% away, about three expected moves. Only 7.6% of the time was it inside the band. The put wall sat below on 96% of closes, a median 4.5% away, about four expected moves.
The next session reached the call wall on about 5% of days (5.3% against 7.2% for a random level placed the same number of expected moves away) and the put wall on about 6% (5.6% against 6.3%). The call wall was reached a little less often than chance would place it. But when price did get there, roughly 100 sessions each, the wall made no difference to what happened next:
| QQQ, next session, when reached | Real wall | Random level, same distance |
|---|---|---|
| Call wall: closed above it | 61.5% | 61.0% |
| Put wall: closed below it | 57.0% | 52.8% |
The put-wall gap points the wrong way for a floor (price closed through it slightly more often) and 17% of random placements did at least as well, so it is noise. This matches our older call and put wall backtest with a different wall definition, where the call wall broke 33.0% of the time against 33.3% for a same-distance control on SPY.
How to read the board
- Measure from the levels, do not trade off them. “Price is 0.6 expected moves from the call wall” is useful context. “Short the call wall” is a claim this data does not support.
- Use the expected move as your yardstick. A fixed-point stop is a different bet on a narrow-band day than on a wide one. Size and targets in expected-move units travel across regimes; fixed points do not.
- Expect the band to be crossed. About four closes in ten finish outside it by construction, and seven sessions in ten touch an edge intraday. A close beyond the band is ordinary; a close beyond twice the band (about one day in twelve) is the unusual one.
- Read the regime first. Net gamma tells you whether to expect a day inside the band or a day that uses all of it.
Limits worth knowing
- Close-to-close on the ETF. The study uses QQQ and SPY closes. The percentages carry over to NQ and ES through the price ratio; the futures’ overnight session is not tested separately.
- Horizon varies before daily expiries. Early in the sample the front expiry was often two to five sessions out; the QQQ inside share was 58.5% at one session and 57.9% beyond.
- Walls tested on QQQ only, on the open-interest lens across all expiries, once per day. The intraday wall, which moves with the session’s flow, failed the same way in a shorter pilot of ours.
- Mid prices. The band uses the straddle mid, as the terminal does. It is what the market prices, not what you could buy the straddle for.
Methodology: tickstream option-chain archive, QQQ and SPY closing chains, 2 January 2019 to 16 June 2026. Expected move = front non-expiring expiry’s ATM straddle mid (strike nearest spot), spot from put-call parity at the close; outcome = close on that expiry date (QQQ official close, SPY parity close). Benchmark 57.5% = P(|Z| < √(2/π)) for a normal distribution. Walls: per-strike dealer gamma evaluated at the strike with each contract’s IV, OI-weighted, all expiries, calls positive and puts negative, extreme strikes within ±6% of spot; the next session’s high and low decide “reached”. Control: the same days with wall distances, in expected-move units, shuffled across days, 500 permutations. Regime = sign of spot-evaluated net gamma at the close.
Frequently asked questions
What is the expected move in options?
It is the price of the at-the-money straddle on the nearest expiry: the call plus the put at the strike closest to spot. That is what the options market charges for the typical absolute move to that expiry. The terminal draws it as spot plus and minus the straddle and does not scale it with any model, because the straddle already is the market's own number.
How accurate is the expected move?
On our archive it is priced about right. From January 2019 to June 2026 the close at the front expiry landed inside the band on 58.3% of QQQ days and 59.8% of SPY days. A fairly priced straddle implies about 57.5%, and the average realised move came to 0.96 to 0.97 of the band. It was too narrow in 2022, the one year the market moved more than the options priced on both symbols.
Is the expected move a one standard deviation range?
No, and that is the most common misreading. A straddle prices the average absolute move, which under a normal distribution is about 0.8 standard deviations, not one. So even a perfectly priced band is left on roughly four days in ten. If you treat it as a 68% range, you will be surprised by it twice as often as you expect.
Do call walls and put walls act as support and resistance?
Not in our data. With the terminal's own definition the call wall sat a median 3.9% above QQQ, and the next session reached it on about 5% of days. On the roughly 100 days it was reached, price closed beyond it 61.5% of the time, against 61.0% for a random level placed the same number of expected moves away. The put wall behaved the same way. A wall tells you where dealer gamma is concentrated, not where price will stop.
What is the zero-gamma flip level?
It is the price at which dealers' net gamma would change sign, found by re-evaluating the whole chain's gamma at hypothetical spot prices and locating the crossing. Above it the chain damps moves, below it the chain amplifies them. It is a boundary between two volatility regimes, not a target, and it is noisier than the sign of net gamma itself.