Dealer Delta Exposure Fails Four Direction Tests in a Row While the Gamma Volatility Result Reproduces on a Second Chain
Delta exposure against the next ES session's move scores r = −0.0060 at p = 0.8002, and grading it against its own trailing quarter changes nothing at r = 0.0047. Five buckets built on it alternate in sign — +$141.94, −$118.99, +$147.36, −$121.68, +$76.05 — with no ordering at all. The gamma volatility finding, meanwhile, travels: SPY gives a next-range ratio of 1.716 at t = 17.59 and QQQ gives 1.618 at t = 15.86, with the directional null intact on both.
Dealer delta exposure, measured against the next ES cash session’s move, scores r = −0.0060 at p = 0.8002. Three other constructions of the same idea score −0.0037, +0.0047 and, against the range instead of the move, +0.0518. That last one is the only figure that clears significance, and it is the volatility story dealer gamma already tells, at roughly an eighth of gamma’s strength.
The second half of this article matters more. Our dealer-gamma result rested on one option chain. Rebuilt on QQQ, against the same ES sessions, the volatility effect reproduces at a ratio of 1.618 against SPY’s 1.716, and the directional null reproduces exactly. That is the strongest single piece of evidence in the options half of this series.
Why delta exposure was the obvious candidate
Gamma told us the size of the next session and nothing about its sign. Delta exposure is where you go next. It is signed, it is the quantity dealers actually have to hedge, and every commercial GEX product prints it beside the gamma number as if the two carried the same kind of information.
So we tested it the way we test everything: four constructions, one baseline, no discretion.
The rule
No trades in the first section. This is an information test, then a bucket test.
- For each session, sum dealer delta across the SPY chain from recorded open interest and the exchange’s delta, dealers long calls and short puts. Express it in billions of dollars.
- Correlate it against the same session’s ES open-to-close move, against the next session’s move, and against the next session’s range.
- Grade it against its own trailing quarter — a 60-session rolling mean and standard deviation — and correlate that against the next session’s move.
- Correlate the day-over-day change in it against the next session’s move.
- Split the graded figure into five equal buckets. Each bucket is simply long one ES contract for the next cash session, cost deducted.
The window is 1,789 sessions, 4 April 2019 to 28 May 2026. It starts later than the chain store does because the trailing-quarter grade needs 60 sessions of history first.
Four ways of asking the direction question
| Measurement | r | p | Sessions |
|---|---|---|---|
| Delta exposure vs the same day’s move | −0.0890 | 0.0002 | 1,789 |
| Delta exposure vs the next day’s move | −0.0060 | 0.8002 | 1,789 |
| Graded delta exposure vs the next day’s move | 0.0047 | 0.8419 | 1,789 |
| Daily change in delta exposure vs the next day’s move | −0.0037 | 0.8770 | 1,788 |
| Delta exposure vs the next day’s range | 0.0518 | 0.0284 | 1,789 |
The first row is the one people mistake for a signal. A correlation of −0.0890 at p = 0.0002 is real. It is also a description of the session you are already sitting in, because open interest is recorded once a day and the move it correlates with happens after it. Move the target one session forward and the same measurement gives −0.0060.
The last row is the only forward-looking figure that clears the usual bar, at p = 0.0284. It is a range, not a direction, and its 0.0518 is an eighth of gamma’s raw 0.4195 on the same kind of target. We already have a volatility term. This is a much weaker version of it.
The buckets, which are the clearest picture of noise in this series
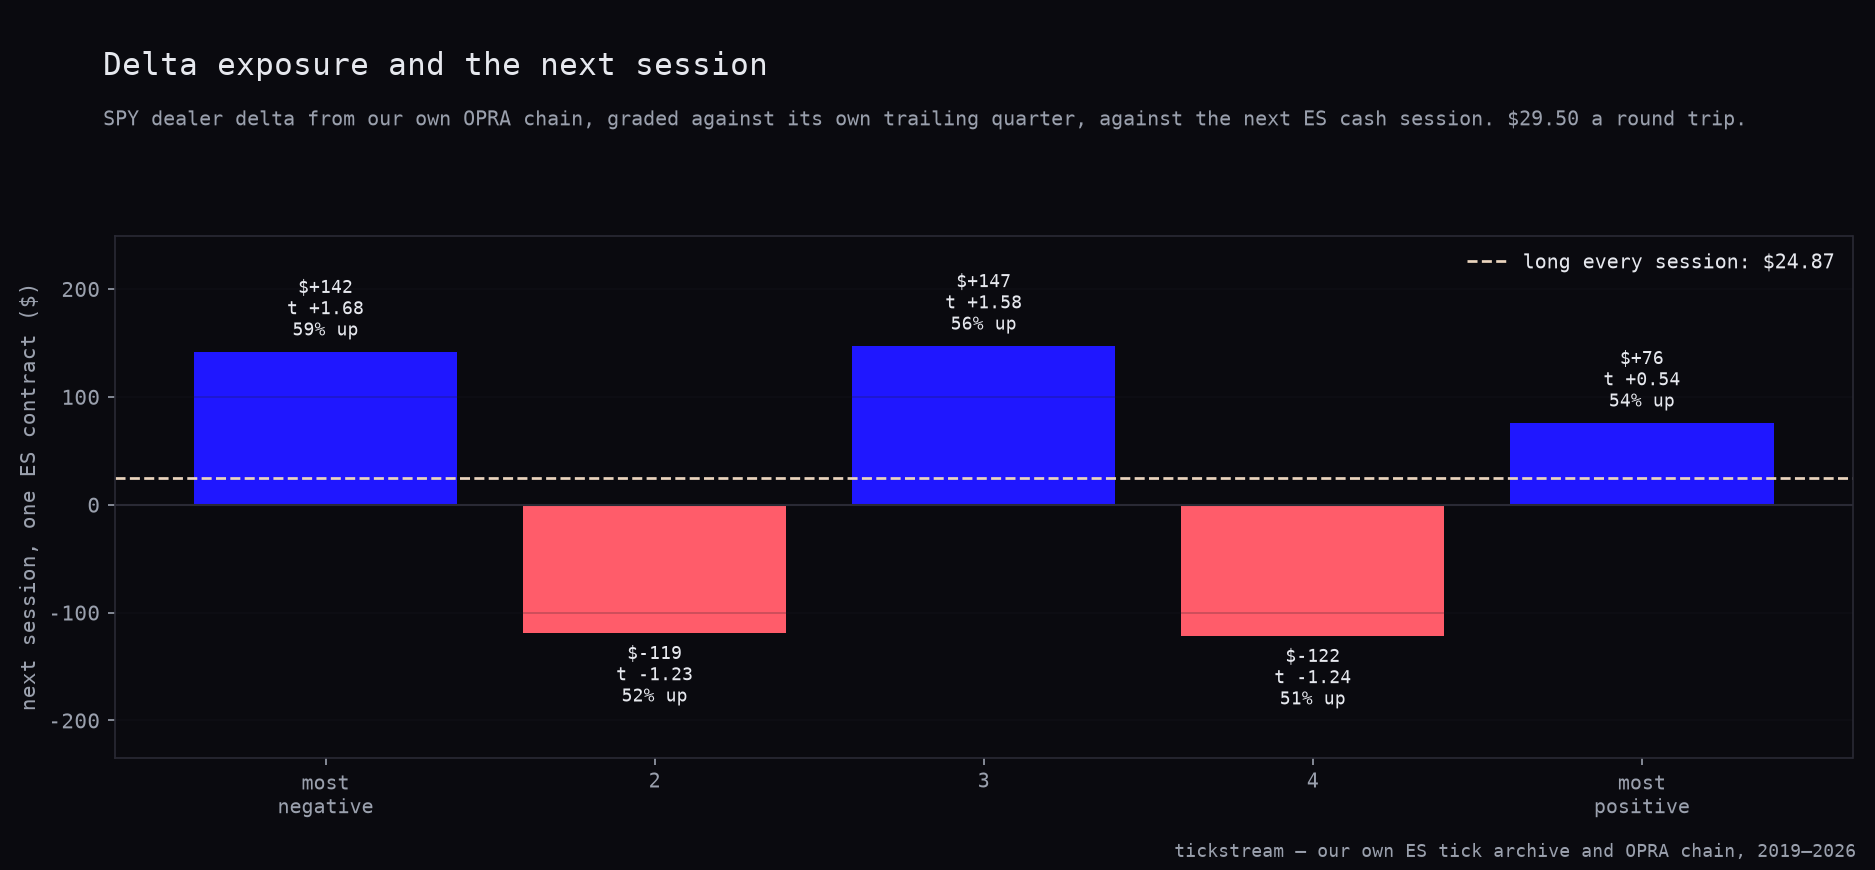
Five groups by graded delta exposure, each long the next session, cost deducted. If delta exposure carried direction, the averages would step. The chart below draws the long-every-session baseline straight across the buckets, so the question is only whether any bar is meaningfully off that line.
| Bucket | Sessions | Mean delta exposure | Next session up | Average | Total | t |
|---|---|---|---|---|---|---|
| Most negative | 358 | +0.38bn | 58.7% | +$141.94 | $50,814.00 | 1.68 |
| 2 | 358 | +0.41bn | 52.2% | −$118.99 | −$42,598.50 | −1.23 |
| 3 | 357 | +0.45bn | 56.3% | +$147.36 | $52,606.00 | 1.58 |
| 4 | 358 | +0.48bn | 51.1% | −$121.68 | −$43,561.00 | −1.24 |
| Most positive | 358 | +0.51bn | 54.2% | +$76.05 | $27,226.50 | 0.54 |
Read the average column downward: plus, minus, plus, minus, plus. The t values do the same thing at 1.68, −1.23, 1.58, −1.24 and 0.54. There is no ordering here of any kind.
Compare it with the gamma version of the same picture, where all five buckets stepped in one direction and the mean gamma inside each bucket stepped with them. That is what a gradient looks like. This looks like five draws from the same hat, and none of the five clears significance on its own.
The baseline says the rest. Long every one of the 1,789 sessions makes +$24.87 a session at t = 0.53, for $44,487.00 total at a profit factor of 1.037. On the per-trade average the first, third and fifth buckets beat that line and the second and fourth lose to it, which is the same alternation again. The best of the three makes $52,606.00 while carrying a $17,766.50 drawdown, and the worse of the two losers gives back $43,561.00 while carrying $69,630.50.
One detail needs saying plainly, because it changes what the table means. The mean delta exposure is positive in every bucket, running from +0.38bn to +0.51bn. The buckets do not separate sessions by the sign of delta exposure. They separate them by delta exposure relative to its own recent past. That is deliberate: the raw level trends over the window, so an ungraded split would sort sessions by calendar date more than by dealer positioning.
The robustness test
This is the more important half, and it is the test almost nobody runs. A result that holds on the instrument you found it on is not yet a result.
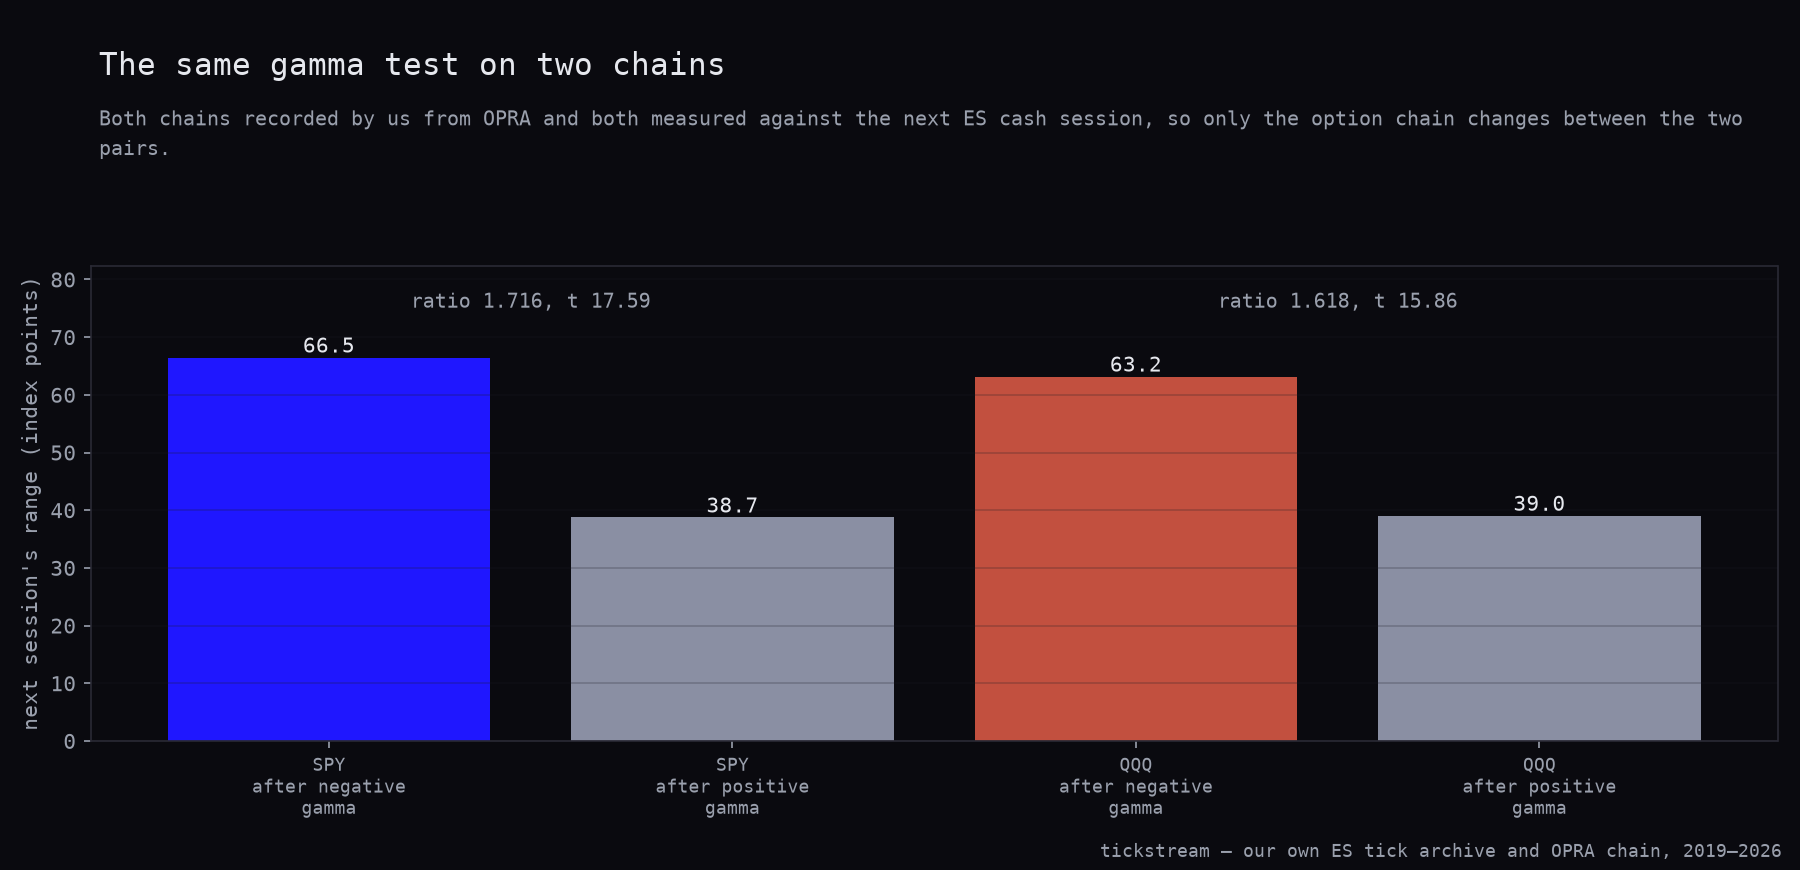
The gamma finding rests on the SPY chain. QQQ has its own chain, its own participants and its own volatility surface. Both are measured against the same ES cash sessions, so between the two pairs below the only thing that changes is the option chain.
| SPY chain | QQQ chain | |
|---|---|---|
| Sessions | 1,848 | 1,848 |
| Negative-gamma sessions | 890 | 1,000 |
| Positive-gamma sessions | 958 | 848 |
| Next range after negative gamma | 66.47 pts | 63.17 pts |
| Next range after positive gamma | 38.74 pts | 39.04 pts |
| Ratio | 1.716 | 1.618 |
| t | 17.59 | 15.86 |
| Raw correlation with the next range | 0.4195 | 0.3357 |
| Partial, yesterday’s range removed | 0.2007 | 0.1512 |
| Correlation with the next move | −0.0138 (p = 0.5531) | 0.0043 (p = 0.8544) |
The volatility effect travels with a slightly smaller effect size. The ratio drops from 1.716 to 1.618, and the raw correlation and the surviving partial step down with it, both in the table above. Every one of those is still a large number by the standards of this series, where the partial-correlation control has flattened almost everything we put through it.
The directional null travels exactly. SPY gives −0.0138 at p = 0.5531 and QQQ gives 0.0043 at p = 0.8544. Two chains, two ways of building the same number, and neither knows which way the S&P goes.
The caveat that keeps it honest
The two gamma series are not independent. Over the 1,859 sessions where both chains are present they correlate at r = 0.7851 and they agree on the sign of dealer gamma 80.0% of the time.
So this is a weaker replication than two unrelated markets would be. It is two option chains on two highly correlated equity indices, hedged by heavily overlapping desks, measured against the same ES sessions. When four sessions in five carry the same sign in both series, the second test is not seeing a fresh sample.
The honest description is that the finding is not an artefact of one chain’s construction. It is not that the finding has been independently replicated. Those are different claims and the 0.7851 is the reason.
What it does rule out is the failure mode we were actually worried about: an SPY-specific quirk of strike spacing, 0DTE concentration or open-interest reporting generating a range effect that has nothing to do with hedging. A quirk of SPY’s board does not show up at t = 15.86 on QQQ’s.
What we changed
Nothing new. Dealer gamma stays where it already was, as a volatility term in the sizing model, and it now carries a second number: 0.1512 on a chain we did not find it on.
Delta exposure does not go into the book at all, on either count. Not as a direction signal, because four constructions produced nothing above p = 0.80 and the buckets alternate. And not as a volatility term either, because its 0.0518 against the next session’s range is a weaker copy of a term we already carry at 0.4195.
The related level-based work is in the gamma walls and max pain test, which is where this line of research stopped being about direction in the first place.
The ES archive every cash session here was built from is for sale — ticks back to 2014 — in the historical data packages.
Methodology: SPY and QQQ option chains from our own OPRA recording, one row per contract per session with the exchange’s greeks, open interest and volume, joined to ES cash sessions built from our own tick archive. Delta and gamma exposure are summed across the chain from recorded open interest, dealers long calls and short puts, expressed in billions of dollars. The delta test covers 1,789 sessions, 4 April 2019 to 28 May 2026; the cross-chain test covers 1,848 sessions per chain, meaning sessions with a next session to measure against, and 1,859 sessions in which both chains carry a reading at all. Sessions run 09:30–16:00 New York. Two limits apply: the chain store begins in 2019 while our ES tick archive goes back to 2014, so this is not a 12.5-year test; and open interest is a daily OCC figure, so every exposure figure describes the state at the START of a session, not intraday. Sessions after 29 May 2026 are excluded because the recorder’s last snapshot of the day is sometimes a truncated post-close chain from which the ATM reference cannot be built. Correlations are Pearson, two-sided p; the partial correlation removes yesterday’s range from both variables by ordinary least squares before correlating residuals; the range comparison is a Welch two-sample t-test. Bucket and baseline results mark the next session’s open-to-close move on one ES contract with costs deducted at $4.50 commission plus two ticks per round trip, $29.50 on ES.
Frequently asked questions
Does dealer delta exposure predict the next day's direction in the S&P?
No, on four separate constructions. The raw level scores r = −0.0060 at p = 0.8002 against the next session's open-to-close move, and grading it against its own trailing quarter gives r = 0.0047 at p = 0.8419. The daily change in it scores r = −0.0037 at p = 0.8770. All three sit inside noise across 1,789 sessions, and the fourth construction — five buckets built on the graded figure — alternates in sign with no bucket clearing significance.
Delta exposure correlates with the same day's move, so why is that not an edge?
Because it describes the session you are already in. The correlation against the same day's move is −0.0890 at p = 0.0002, which is real and small. Push the same measurement one session forward and it collapses to −0.0060 at p = 0.8002.
Do the delta-exposure buckets show any gradient?
None. The five buckets average +$141.94, −$118.99, +$147.36, −$121.68 and +$76.05 on the next session, with t values of 1.68, −1.23, 1.58, −1.24 and 0.54. The signs alternate rather than order, and the long-every-session baseline over the same 1,789 sessions makes +$24.87 at t = 0.53.
Does the negative-gamma volatility result hold on an option chain other than SPY?
Yes. On SPY the next ES range averages 66.47 points after negative gamma against 38.74 after positive, a ratio of 1.716 at t = 17.59. Rebuilt on the QQQ chain against the same ES sessions it gives 63.17 against 39.04 points, a ratio of 1.618 at t = 15.86. The partial correlation after yesterday's range is removed is 0.2007 on SPY and 0.1512 on QQQ.
Is that a genuine independent replication?
No, and calling it one would overstate it. The two gamma series correlate at r = 0.7851 over 1,859 shared sessions and agree on sign 80.0% of the time. The honest reading is that the finding is not an artefact of one chain's construction, not that it has been independently replicated.