Negative Dealer Gamma Runs the S&P's Next Range 1.7 Times Wider and Still Loses to Yesterday's Range
After a negative dealer-gamma session the next ES cash session ranges 66.47 points, against 38.74 after a positive one — a ratio of 1.716 at t = 17.59 across 1,848 sessions of our own OPRA chain. Yesterday's range forecasts the same target at r = 0.6547 against gamma's 0.4195, so the free number wins outright. But gamma keeps a partial correlation of 0.2007 once yesterday's range is removed, the largest surviving residual in this series. Direction is nothing: r = −0.0138 at p = 0.5531.
After a negative dealer-gamma session, the next ES cash session ranges 66.47 points. After a positive one it ranges 38.74. That is a ratio of 1.716 at t = 17.59 across 1,848 sessions, and it is the largest regime effect this series has measured.
It is also the most nuanced result we have published. The effect is real, it is graded rather than binary, and it survives the partial-correlation control that has killed almost everything else we tested this year. It still loses to yesterday’s range, which is free, and it fails completely at the job most people give it.
The data, since this is the first options article in the series
The options half of this series runs on our own OPRA recording: one row per contract per session, with the exchange’s greeks, open interest and volume. This test uses 1,848 SPY chain sessions from 2 January 2019 to 28 May 2026, joined to ES cash sessions. Dealer gamma is computed from the recorded open interest and the exchange’s own gamma, with the standard convention that dealers are long calls and short puts.
Two limits are load-bearing and both are stated again in the method line at the bottom.
- Open interest is a daily OCC figure. Everything derived from it describes the state at the start of a session, not intraday.
- Sessions after 29 May 2026 exist in the store but are excluded. The recorder’s last snapshot of the day is sometimes a thin post-close chain, which truncates the board and breaks the ATM reference. Those rows are dropped rather than quietly averaged in.
Note the window. The ES tick archive goes back to 2014, but the option chain does not, so this is a 7.5-year test rather than a 12.5-year one. Where the extra five years matter in this series, we say so. Here they are simply not available.
The rule
No trades in the first three sections. This is an information test.
- For each session, sum gamma exposure across the SPY chain from recorded open interest and the exchange’s gamma, dealers long calls and short puts. Express it in billions of dollars per 1% move.
- Split sessions on the sign of that figure, and separately into five equal quintiles.
- Measure the next ES cash session’s range, its absolute open-to-close move, and whether it closed up.
- Run the same measurement for yesterday’s range, ATM implied volatility and 20-day realised volatility, as benchmarks.
- Then remove yesterday’s range from both gamma and the next session’s range by ordinary least squares, and correlate the residuals.
Throughout, the correlation labelled “gamma” is against negative gamma, so a positive number means more negative gamma comes with a wider next session.
The gradient, which is what makes it credible
A regime claim that only works as an on/off switch is usually a threshold that was chosen after the fact. This one is monotone across all five buckets, and the average gamma inside each bucket steps cleanly with it.
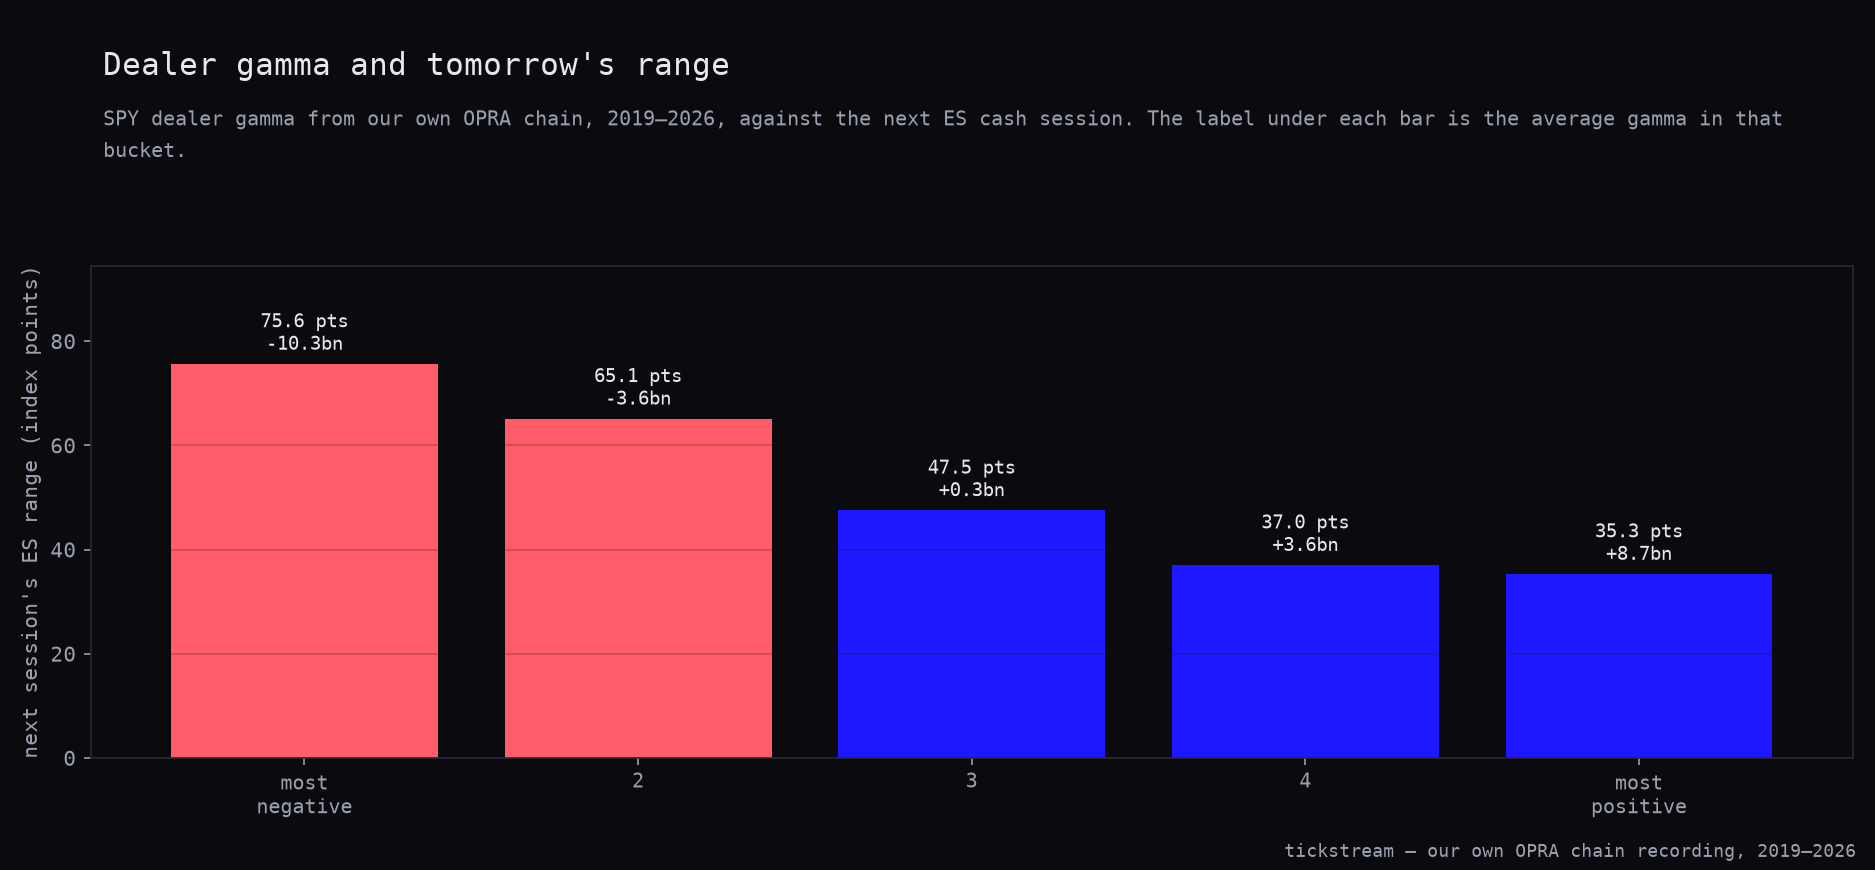
| Gamma quintile | Sessions | Mean gamma | Next range | Next absolute move | Next session up |
|---|---|---|---|---|---|
| Most negative | 370 | −10.32bn | 75.62 pts | 39.77 pts | 54.3% |
| 2 | 369 | −3.63bn | 65.09 pts | 35.25 pts | 57.2% |
| 3 | 370 | +0.31bn | 47.51 pts | 24.76 pts | 54.3% |
| 4 | 369 | +3.64bn | 36.99 pts | 17.71 pts | 55.0% |
| Most positive | 370 | +8.73bn | 35.28 pts | 17.31 pts | 52.4% |
Every step in the range column goes the right way, and so does every step in the absolute-move column. The gap between the extreme buckets is 40.34 points of ES range. That is not a rounding artefact and we are not going to pretend it might be.
The sign split is the same finding, coarser: 890 negative-gamma sessions at 66.47 points against 958 positive-gamma sessions at 38.74, t = 17.59, p rounding to zero.
The control it has to pass, and does not win
Every volatility claim in this series is reported next to yesterday’s volatility, in the same table, on the same sample. Gamma comes third.
| Predictor of the next session’s range | r | p | n |
|---|---|---|---|
| Yesterday’s range | +0.6547 | 0.0 | 1,848 |
| ATM implied volatility | +0.5261 | 0.0 | 1,848 |
| Negative dealer gamma | +0.4195 | 0.0 | 1,848 |
| 20-day realised volatility | +0.3580 | 0.0 | 1,848 |
So the reconstructed gamma board loses to two numbers that cost nothing and are already on the screen. Yesterday’s range is one subtraction. ATM implied volatility is one quote. That is the first half of the verdict, and on its own it would be the whole article — it is how the entropy test ended.
This is where dealer gamma differs from everything else we have run. Partial out yesterday’s range from both sides and gamma still contributes r = 0.2007, with p rounding to zero on 1,848 sessions. ATM implied volatility contributes 0.2630 on the same control.
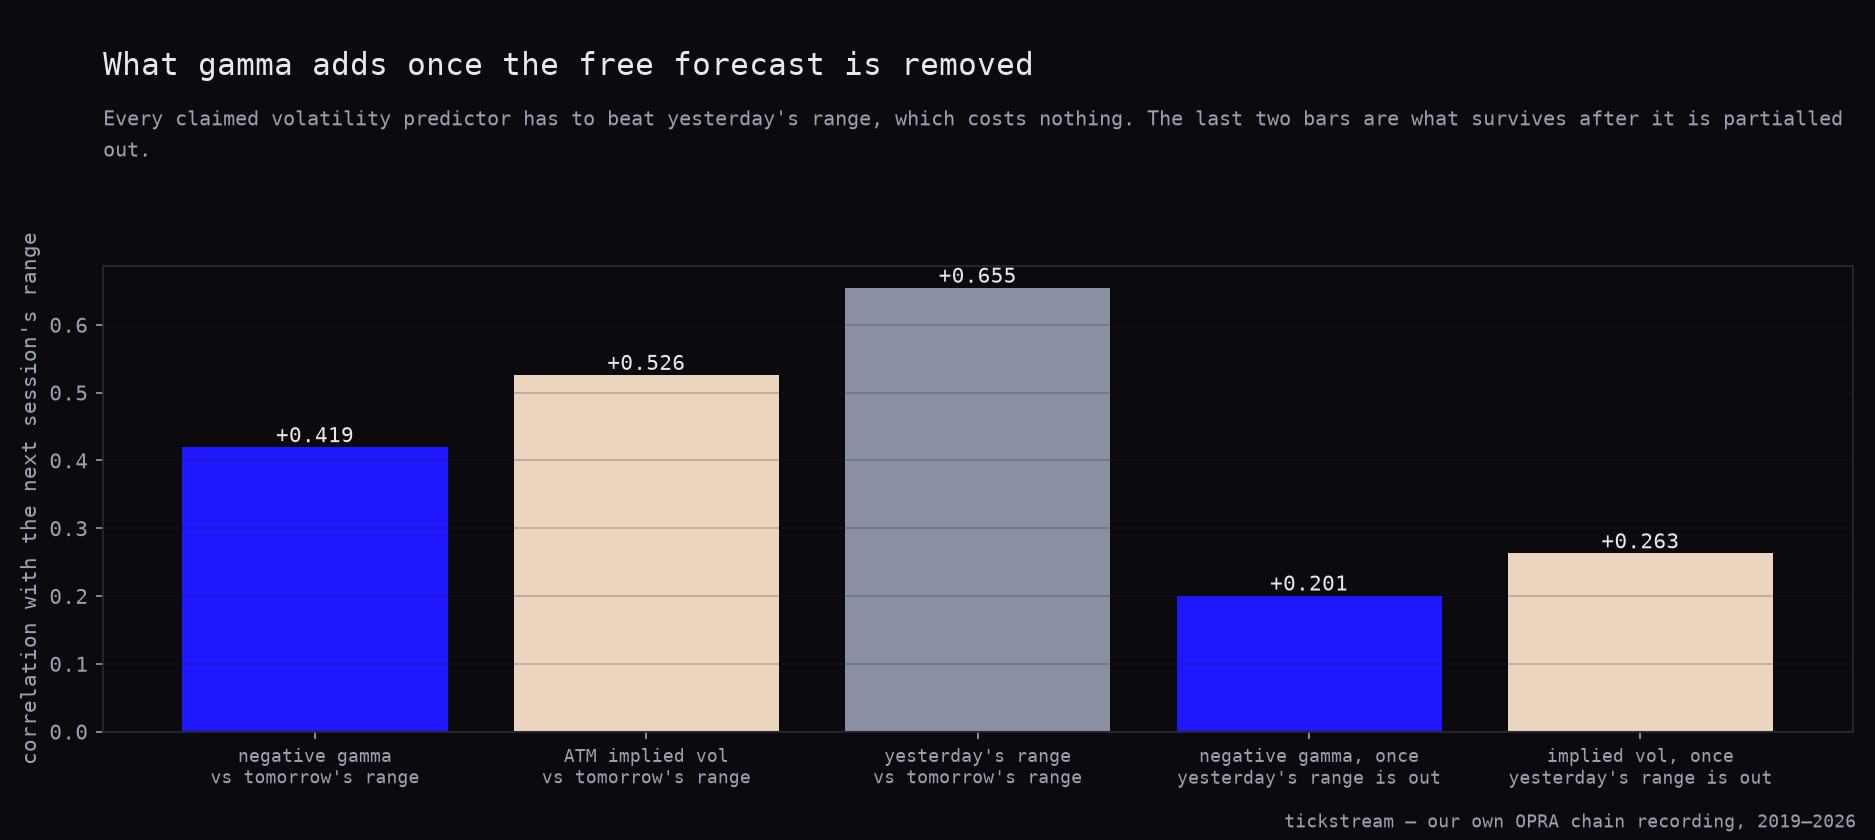
The two right-hand bars are the point of the chart. A residual of 0.2 is the largest we have measured in this series. Session entropy managed 0.064 against the same control. Large-trade flow at range breakouts managed −0.008. Those are numbers you write down and walk away from. Two-tenths is not. It is far too small to size a single position on, and it is large enough to earn a column inside a volatility model that already has yesterday’s range in it.
That distinction — useless alone, useful as an input — is the honest reading of dealer gamma, and it is rarer than either the people selling gamma boards or the people dismissing them tend to allow.
Direction, where there is nothing
A volatility forecast is not a direction forecast, but the gamma pitch usually slides between the two. So we measured it directly.
The correlation between dealer gamma and the next session’s open-to-close move is −0.0138, with p = 0.5531 on 1,848 sessions. There is no directional signal in this number at any strength we can detect.
The bucket test looks different, and it is worth being precise about why.
| Bucket | Next session closes up | p vs 50% |
|---|---|---|
| After negative gamma | 56.3% | 0.0002 |
| After positive gamma | 53.1% | 0.0566 |
| All sessions | 54.7% | — |
Those p-values are measured against a coin flip, not against the base rate. The base rate is 54.7%, because the S&P went up over this window. Against the number that actually matters, the negative-gamma bucket is 1.6 percentage points better and the positive-gamma bucket is 1.6 points worse. A test against 50% on a rising index will find significance in almost any bucket you draw, and that is exactly what happened here.
This is the same conclusion we have reached four times from the other direction. We have now killed the gamma level family in four separate tests: gamma walls do not hold price, the flip level is noise about a quarter of the time, options flow at a wall tests as a placebo, and stacking gamma levels with volume profile and order flow added nothing to any of them. This article approaches from the regime side and lands in the same place. Gamma carries how far, not which way.
The part that keeps it honest
A volatility forecast is for sizing, so we tried the obvious use. Same signal, same instrument, no entry rule at all: long one ES contract every day, open to close, and halve the size in the most negative gamma quintile.
| Long every day, flat size | Half size in most negative quintile | |
|---|---|---|
| Sessions | 1,848 | 1,848 |
| Win rate | 54.7% | 54.7% |
| Average | $56.87 | $42.58 |
| Median | $150.00 | $131.25 |
| Total | $105,100.00 | $78,687.50 |
| Profit factor | 1.088 | 1.077 |
| Max drawdown | $39,775.00 | $34,037.50 |
| Best day | $25,325.00 | $12,662.50 |
| Worst day | −$12,737.50 | −$9,650.00 |
| Sharpe | 0.46 | 0.42 |
| t | 1.25 | 1.14 |
| p | 0.2115 | 0.2564 |
Drawdown falls from $39,775.00 to $34,037.50, which is what the overlay is supposed to do. Everything else falls with it. Return drops by more than a quarter, profit factor slips from 1.088 to 1.077, and Sharpe goes from 0.46 to 0.42.
The reading is straightforward. On this window the high-gamma-risk days were not disproportionately the losing days. They were bigger in both directions, so cutting size there cut return and risk in roughly equal measure and bought no improvement in the ratio.
Two caveats, because the table does not support a stronger claim than it makes. The Sharpe difference of 0.04 is small. And neither line is significant on its own — t = 1.25 at p = 0.2115 for the flat version, t = 1.14 at p = 0.2564 for the overlay. So this is not evidence that the overlay is harmful. It is evidence that the obvious use of a good volatility forecast did not work here, and that a volatility forecast has to be paired with a return forecast before it can earn anything.
What we changed
Nothing went live. We already treated dealer gamma as a volatility feature rather than a direction feature, and we already refused to trade gamma levels. What changed is that both positions now have a number attached: 0.2007 after the free benchmark is removed, and −0.0138 against direction.
That is the whole of it. Gamma stays in the volatility feature set, next to yesterday’s range and ATM implied volatility, where its two-tenths can contribute to a forecast someone else’s return model has to act on. It does not become a signal, it does not get a sleeve, and it does not tell anyone which way to lean.
The ES archive this ran against is for sale — ticks back to 2014, from which every cash session here was built — in the historical data packages.
Methodology: SPY option chains from our own OPRA recording, one row per contract per session with the exchange’s greeks, open interest and volume, joined to ES cash sessions built from our own tick archive. 1,848 sessions, 2 January 2019 to 28 May 2026, 09:30–16:00 New York. Dealer gamma is summed across the chain from recorded open interest and the exchange’s gamma, dealers long calls and short puts, expressed in billions of dollars per 1% move. Two limits apply: open interest is a daily OCC figure, so this describes the state at the START of each session and not intraday; and sessions after 29 May 2026 are excluded because the recorder’s last snapshot of the day is sometimes a truncated post-close chain from which the ATM reference cannot be built. Correlations are Pearson, two-sided p; partial correlations remove yesterday’s range from both variables by ordinary least squares before correlating residuals. The sizing table marks the open-to-close move at $50 per ES point without cost deduction; both columns carry identical cost, so the comparison between them is unaffected. The series cost convention where trades are simulated is $4.50 commission plus two ticks per round trip, $29.50 on one ES contract.
Frequently asked questions
Does negative dealer gamma actually mean a bigger move the next day?
Yes, and it is the largest regime effect we have measured. Across 1,848 sessions the next ES cash range averages 66.47 points after a negative-gamma session and 38.74 points after a positive one, a ratio of 1.716 with t = 17.59 and p rounding to zero. It is also a gradient rather than a switch: the five gamma quintiles produce 75.62, 65.09, 47.51, 36.99 and 35.28 points in order.
Is dealer gamma a better volatility forecast than what is already on my screen?
No. Gamma correlates 0.4195 with the next session's range. Yesterday's range correlates 0.6547 with the same target and costs nothing, and ATM implied volatility scores 0.5261. Gamma finishes third of four, ahead only of 20-day realised volatility at 0.3580.
Does anything survive once yesterday's range is controlled for?
More than usual. Partialling out yesterday's range leaves gamma with 0.2007 at p rounding to zero on 1,848 sessions, against 0.2630 for ATM implied volatility. For scale, the same control left session entropy with 0.064 and left large-trade flow at breakouts with −0.008. A residual of 0.2 is worth carrying inside a volatility model.
Can dealer gamma tell you which way the S&P goes?
No. The correlation between gamma and the next session's open-to-close move is −0.0138 with p = 0.5531. The next session closes up 56.3% of the time after negative gamma, but the all-session base rate is 54.7%, so the real edge is 1.6 percentage points and the quoted p-value of 0.0002 is measured against 50%, not against that base rate.
Did halving size in the most negative gamma quintile improve anything?
It improved nothing. Long every day at flat size makes $105,100.00 over 1,848 sessions at Sharpe 0.46; halving size in the most negative quintile makes $78,687.50 at Sharpe 0.42. Maximum drawdown falls from $39,775.00 to $34,037.50, so the overlay cut return and risk together without buying a better ratio.