Gamma Walls Reject Price 52.9% of the Time and So Does a Level With No Wall on It
We tested the call wall, the put wall and max pain on 1,848 sessions of our own SPY chain against the next ES cash session. Not one of the five levels is reached more often than an equally distant nameless price — the best is max pain at +2.0 percentage points, t = 1.64. The rejection claim looks real against a mirrored control, +7.3 points at t = 3.23, and disappears completely against a control on the same side of the market: +0.8 points at p = 0.7266. Price moved closer to max pain on 36.0% of sessions, and fading the call wall lost $38,712.86 over 147 trades.
Every GEX product on the market draws the same three lines: a call wall, a put wall and a max-pain strike. We put all of them, plus the two open-interest walls, through 1,848 sessions of our own SPY option chain against the next ES cash session. Not one level is reached more often than a nameless price the same distance away, and the largest gap in the table is max pain at +2.0 percentage points, t = 1.64.
The rejection test is the interesting half. Measured against a mirrored control, the walls look publishable: price closes back through the call wall 7.3 percentage points more often than through its mirror, at t = 3.23. We believed that for about ten minutes. Then we ran the control that keeps the side of the market fixed, and the whole thing went to 0.8 points at p = 0.7266.
The rule
- Levels come from our own OPRA recording of the SPY chain, one row per contract per session, on the session that has just closed. The gamma walls are the strikes above and below spot with the largest open interest times gamma. The open-interest walls are the same without the gamma weighting. Max pain is the strike that minimises total option-holder value.
- Each level is converted to a percentage of SPY spot and applied to the next ES cash session’s open, because ES trades near ten times SPY. Everything below is measured on the ES session.
- Reached means the next session’s high touched a level above the open, or its low touched a level below it. Levels sitting within 2 ES points of the open are dropped.
- Rejected means the session closed back on the open’s side of a level it had reached.
- Control 1, the mirror: the same distance from the open, on the other side of spot.
- Control 2, the shift: the same side of the market, same session, moved 30% further from the open. No wall on it, nobody watching it.
Both controls are measured exactly like the level.
The levels are not reached more often than nothing
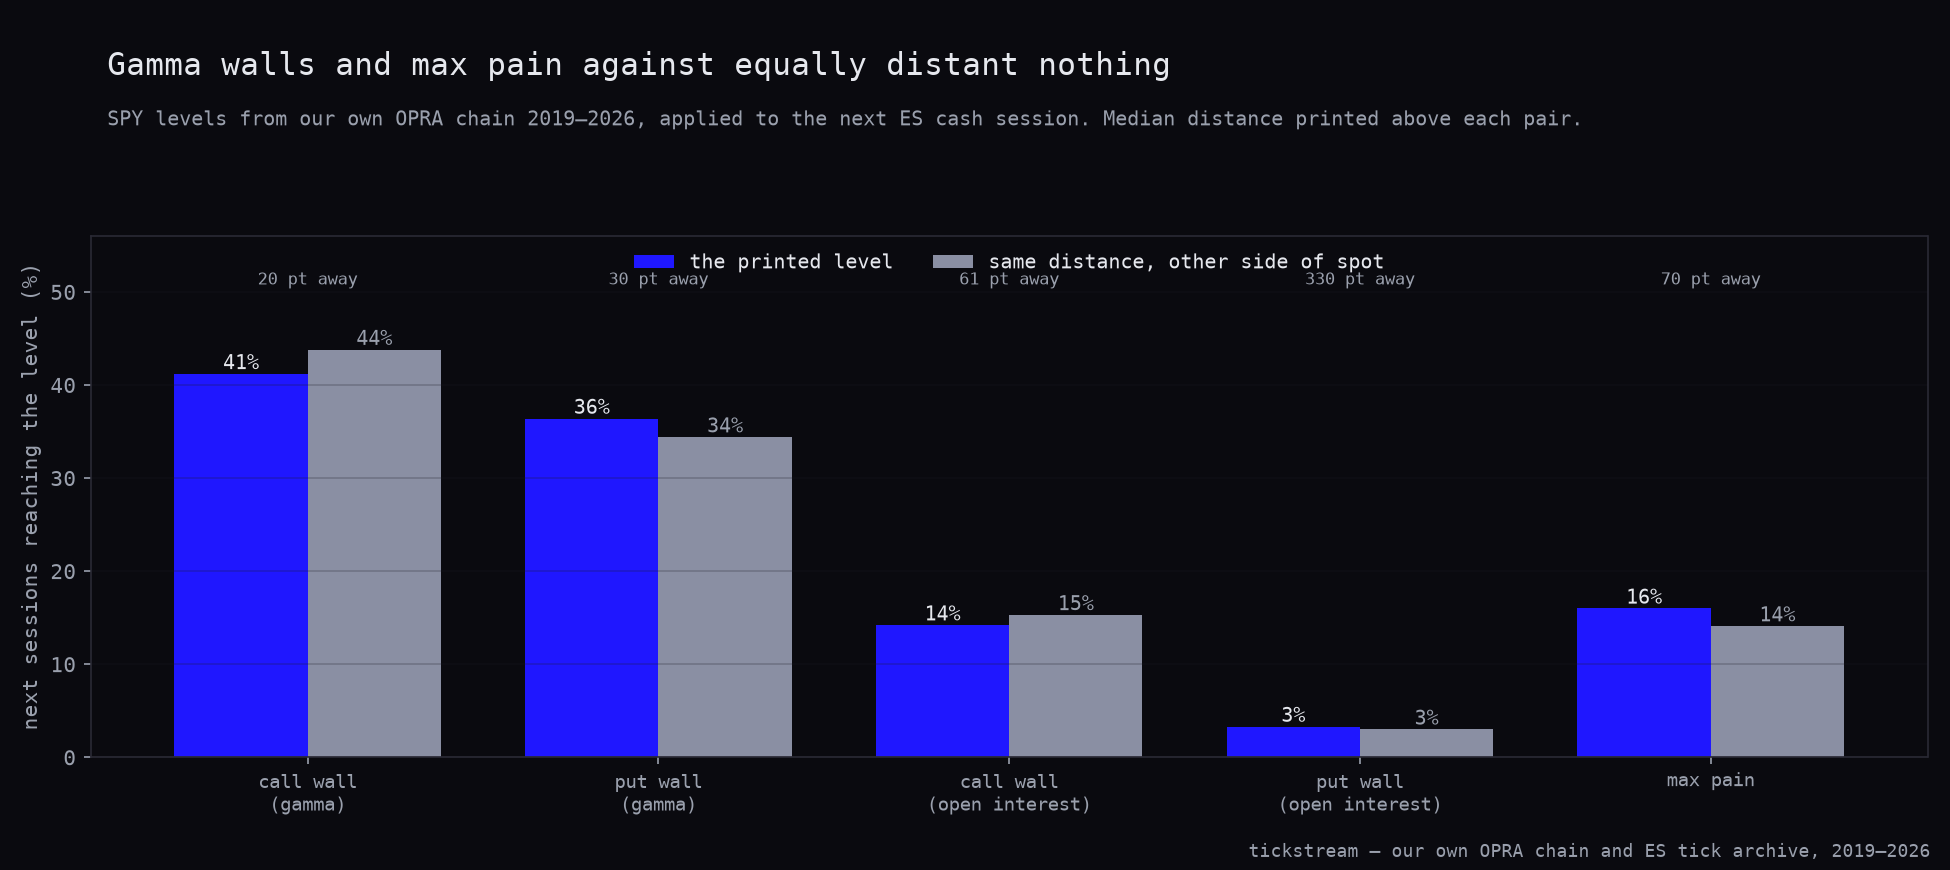
The chart below is the reach test, not the rejection test. Each pair is one printed level against a price the same distance away on the other side of spot, with the median distance printed above the pair. The rejection test comes in the next section, and it is where the article actually turns.
| Level | Sessions | Median distance | Reached | Mirror | Edge | t | p |
|---|---|---|---|---|---|---|---|
| Call wall (gamma) | 1,520 | 20.1 pt | 41.2% | 43.8% | −2.6pp | −1.43 | 0.1525 |
| Put wall (gamma) | 1,641 | 29.99 pt | 36.4% | 34.4% | +2.1pp | 1.24 | 0.2147 |
| Call wall (open interest) | 1,743 | 60.73 pt | 14.2% | 15.3% | −1.1pp | −0.96 | 0.3395 |
| Put wall (open interest) | 1,838 | 329.59 pt | 3.3% | 3.0% | +0.2pp | 0.38 | 0.706 |
| Max pain | 1,789 | 70.29 pt | 16.0% | 14.1% | +2.0pp | 1.64 | 0.1019 |
Not one row clears p = 0.10. The largest edge in the table is max pain, +2.0 percentage points at p = 0.1019, and two of the five edges are negative.
Read the distance column before the reach column, because the first explains the second. The gamma call wall is reached on 41.2% of sessions and sits 20.1 points from the open. The open-interest put wall is reached on 3.3% of sessions and sits 329.59 points away. A level a third of a thousand ES points below the open is not a forecast of anything. It is a strike where somebody once wrote a lot of contracts, and it stays on the chart long after the position that put it there stopped mattering.
The rejection test, and how we nearly published it
Reaching a level was never the claim anyway. The claim is that price is repelled by it. So we took the sessions that reached each wall and asked how many closed back through it, against the same measurement at the mirror.
| Wall | Sessions reaching | Closed back through | Mirror | Edge | t | p |
|---|---|---|---|---|---|---|
| Call wall (gamma) | 954 | 52.9% | 45.6% | +7.3pp | 3.23 | 0.0012 |
| Put wall (gamma) | 805 | 53.2% | 43.1% | +10.1pp | 4.03 | 0.0001 |
Both sides. Both significant. Nearly two thousand sessions between them, a double-digit edge on the put wall, and a p-value of 0.0001. If you stop here you have a result, and a chart, and a course to sell.
The problem is the mirror. It sits on the other side of spot, so “reached it and came back” is a physically different journey depending on which way the market had to travel to get there. The S&P falls faster than it rises. A control that swaps the direction is measuring that asymmetry, not the wall.
The control that isolates the wall keeps the side and moves the price: same session, same direction, 30% further out, no wall on it.
| Wall | Closed back through | Shifted level | Sessions reaching shifted | Edge | t | p |
|---|---|---|---|---|---|---|
| Call wall (gamma) | 52.9% | 52.1% | 831 | +0.8pp | 0.35 | 0.7266 |
| Put wall (gamma) | 53.2% | 51.3% | 688 | +1.9pp | 0.72 | 0.4737 |
Nothing survives. The call wall’s 7.3-point edge becomes 0.8 points at p = 0.7266. The put wall’s 10.1 becomes 1.9 at p = 0.4737. Price closes back through a level with a wall on it at very nearly the rate it closes back through a level 30% further out with nothing on it at all.
This is the third time in this series that a mirrored control has produced a large, significant, entirely fake result. It happened with the floor pivots and Camarilla levels, where mirroring turned S2 into a 24.2-point edge and the same-side control took every one of the nine levels to nothing. It happened again with the 80% rule and the value-area edges. Now it has happened with the gamma walls, on a different instrument, a different data source and a different measurement.
We should have caught it faster than we did. What we have done since is change the rule rather than the article: a mirror is now a diagnostic for direction asymmetry, and it is never the control for a level. If a level test does not hold the side of the market fixed, it is not a level test.
Max pain is not a magnet
Max pain has a stronger claim than the walls do. It is not supposed to repel price, it is supposed to draw it. So the test is simple: does price end the session closer to the max-pain strike than it started?
Across 1,848 sessions it moved closer 36.0% of the time, with p rounding to zero, at a mean distance of 1.93% of spot. Price moves away from max pain almost two sessions in three.
| Weekday | Sessions | Moved closer | p |
|---|---|---|---|
| Monday | 346 | 40.2% | 0.0003 |
| Tuesday | 383 | 35.8% | 0.0 |
| Wednesday | 381 | 36.7% | 0.0 |
| Thursday | 372 | 32.3% | 0.0 |
| Friday | 366 | 35.2% | 0.0 |
Every weekday is significantly below 50%. If the pin were real, it would tighten into Friday expiry and the column would slope upward. Instead Thursday is the worst day in the table at 32.3%, and Monday, the day furthest from expiry, is the best at 40.2%.
One honest caveat, because 36.0% invites an overclaim. A random walk that starts at a distance from any fixed point moves away from it more often than toward it, simply because there is more room on the far side. So 36.0% is not evidence that max pain repels price. It is evidence that there is no pin. That is the whole claim, and it is enough to retire the level.
The traded version
The walls get traded one way in practice: sell the call wall when price reaches it. We ran exactly that. Entry at the wall on the touch, stop 0.4% above it, target the session open, one ES contract, costs in.
| Fade the call wall | |
|---|---|
| Trades | 147 |
| Win rate | 30.6% |
| Average | −$263.35 |
| Total | −$38,712.86 |
| Median | −$464.62 |
| Profit factor | 0.415 |
| Max drawdown | $38,754.94 |
| Best | $2,981.21 |
| Worst | −$1,387.61 |
| Sharpe | −1.62 |
| t | −4.41 |
| p | 0.0 |
A profit factor of 0.415 means the rule gave back two and a half dollars for every one it made. The drawdown of $38,754.94 is larger than the total loss, which is what happens when a losing rule has one good run in it — the best trade here made $2,981.21. The one setup this family actually gets traded as is also the worst-scoring thing in the article.
What we changed
Nothing, and that is now a five-time answer for this family.
We first tested the walls on QQQ chains and found they describe the day without being tradeable. We built them into a four-way confluence stack with volume profile, order flow and the opening range, and watched half a million dollars of backtest turn into a fill artefact. We measured the options flow at wall touches against fake levels and found the defence flow at both. Our intraday pilot on the flip level found it unusable on roughly a quarter of sessions. This is the fifth, and the first at daily resolution with a control that actually isolates the level.
The contrast is the point. One member of this family did survive, and it is not a line on a chart. Dealer gamma as a regime measure works: after a negative-gamma session the next ES cash session ranges 1.7 times wider, at t = 17.59 on the same 1,848 sessions, and it keeps a partial correlation of 0.2007 once yesterday’s range is removed. The same chain, the same window, the same greeks. What differs is the question.
Dealer positioning tells you how much the market will move. It does not tell you where it will go, and the strikes it prints are not places where price stops.
The ES archive behind every cash session in this test is for sale in the historical data packages.
Methodology: SPY option chains from our own OPRA recording, one row per contract per session with the exchange’s greeks, open interest and volume, joined to ES cash sessions built from our own tick archive. 1,848 sessions, 2 January 2019 to 28 May 2026, 09:30–16:00 New York. The chain store starts in 2019, so this is a 7.5-year test rather than the 12.5 years the ES tick archive carries. Walls and max pain are computed on SPY, converted to a percentage of SPY spot and applied to the next ES session’s open. Open interest is a daily OCC figure, so every level here describes the state at the START of the session, not intraday. Sessions after 29 May 2026 are excluded because the recorder’s last snapshot of the day is sometimes a truncated post-close chain. Levels within 2 ES points of the open are dropped. Controls: mirrored across the open at equal distance, and shifted 30% further from the open on the same side. Reach and rejection significance from Welch two-sample t-tests on the rates, max-pain convergence from a two-sided binomial test against 50%, trade P&L from a one-sample t-test. Costs $4.50 commission plus two ticks per round trip, $29.50 on one ES contract at $12.50 a tick.
Frequently asked questions
Does price actually get rejected at the gamma call wall?
Not measurably. Of the 954 sessions that reached the call wall, 52.9% closed back through it. A level 30% further out with no wall on it was closed back through on 52.1% of the 831 sessions that reached it. The gap is 0.8 percentage points at t = 0.35 and p = 0.7266, which is nothing.
Why do gamma walls look like they work in most tests?
Because the usual control is mirrored to the other side of spot, and that turns the test into a measurement of the S&P's up/down asymmetry. Against a mirror the call wall shows +7.3 percentage points at t = 3.23 and the put wall +10.1 points at t = 4.03, both apparently significant. Keep the side of the market fixed and move only the price, and both collapse to 0.8 and 1.9 points.
Is max pain a real magnet on the S&P 500?
No. Across 1,848 sessions price moved closer to the max-pain strike 36.0% of the time, and the p-value rounds to zero. The weekday split gives Monday 40.2%, Tuesday 35.8%, Wednesday 36.7%, Thursday 32.3% and Friday 35.2%, so there is no build into expiry — Thursday is the worst day in the table.
Which of the five printed levels is reached most often?
The gamma call wall, on 41.2% of next sessions, and that is a function of distance rather than of the wall: it sits 20.1 points away at the median. The open-interest put wall sits 329.59 points away and is reached on 3.3% of sessions. Its mirror is reached on 3.0%, an edge of 0.2 percentage points at p = 0.706.
Does fading the call wall make money on ES?
It loses badly. Selling the call wall on the touch with a stop 0.4% above and the session open as target produced 147 trades, a 30.6% win rate and −$38,712.86 after costs, an average of −$263.35 a trade. The profit factor was 0.415, the Sharpe −1.62 and t = −4.41.