"Draw on Liquidity" Tested: Are Equal Highs and Unmitigated FVGs Really Magnets? 7 Years, Base-Rate Controlled
The viral concept: the market moves 'from liquidity to liquidity' — equal highs/lows and unmitigated higher-timeframe fair value gaps act as draws, and they tell you the daily bias. We measured it on 1,770 trading days of NQ with the control the videos never run: arbitrary levels at the same distance. Result: the 'magnet' touches at or below base rate everywhere — distant liquidity is reached significantly LESS often than random prices — and the daily-bias rule is a coin flip that costs you $283k against doing nothing. The reason is built into the concept itself.
The pitch, translated from a German video making the rounds: unprofitable traders don’t know how to determine the Daily Buyers. The market only moves from liquidity to liquidity. Draw a few equal highs, equal lows, relative equal highs, unmitigated higher-timeframe fair value gaps — the market tends to collect these levels. If the draw is below, look only for shorts. Comment “free” for the 20-minute version.
Every clause of that is measurable, and we have the data the 20-minute version doesn’t use: 1,770 Globex trading days of NQ built from real trade prints, and — the part these videos never include — a control group.
The magnet, measured
We detected every active draw the way the concept defines it, ex-ante: equal highs/lows (two daily extremes within 0.05% that haven’t been taken out since), relative equals (within 0.12%), and unmitigated daily fair value gaps (three-candle imbalances price hasn’t traded back into). Then the only question that matters: how often does price actually reach the level within ten days — versus an arbitrary price at the exact same ATR-normalized distance?
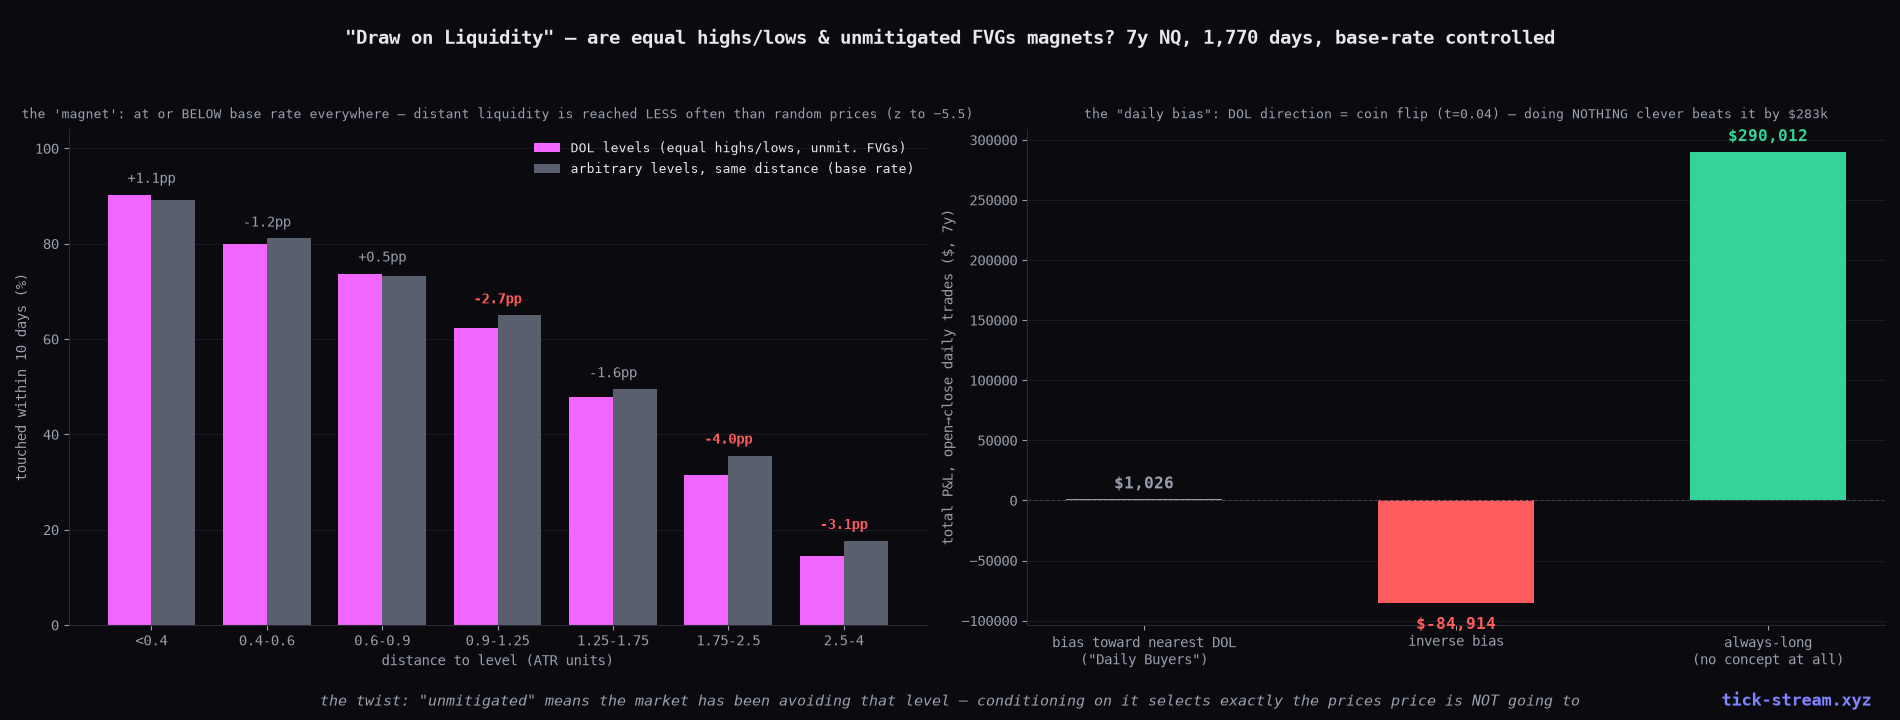
| Distance (ATR) | DOL touched | Base rate | Δ | z |
|---|---|---|---|---|
| < 0.4 | 90.3% | 89.2% | +1.1pp | 1.5 |
| 0.9 – 1.25 | 62.3% | 65.0% | −2.7pp | −2.5 |
| 1.75 – 2.5 | 31.6% | 35.6% | −4.0pp | −4.6 |
| 2.5 – 4 | 14.5% | 17.7% | −3.1pp | −5.5 |
Nearby, the “magnet” is exactly base rate — price reaches a level 0.3 ATR away about 90% of the time because price reaches anything 0.3 ATR away about 90% of the time. That 90% is what makes the concept feel true on every chart replay. And at distance, the result flips sign: active liquidity draws are reached significantly less often than random prices at the same distance, consistently, across every parameter set we tried (tight, primary, wide — same shape in all three).
Why the magnet repels: the selection is the mechanism
This isn’t a quirk — it’s built into the definition. “Unmitigated” means the market has already spent days or weeks not going there. Conditioning on a level being “still active” is conditioning on avoidance: the longer a draw survives untouched, the more likely it marks a direction the market has abandoned. The concept selects, with precision, the prices the market is not working toward — and then calls them targets.
This is the fourth independent measurement in the same family to land on the same inversion: untouched levels hold worse, not better; level “reactions” are base rate; sweep-reversals fail placebo; and now draws touch below base rate. Different vocabulary, same arithmetic.
The “Daily Buyers”: a coin flip that costs $283,000
The practical promise of the video is the bias: draw below → shorts only. So we traded it — every day, open to close, in the direction of the nearest active draw, honest costs:
- Bias toward the nearest draw: +$1,026 over seven years. t = 0.04. A coin flip, minus commissions.
- Inverse bias: −$84,914 (a zero signal loses both ways once costs exist).
- No concept at all — long every day: +$290,012.
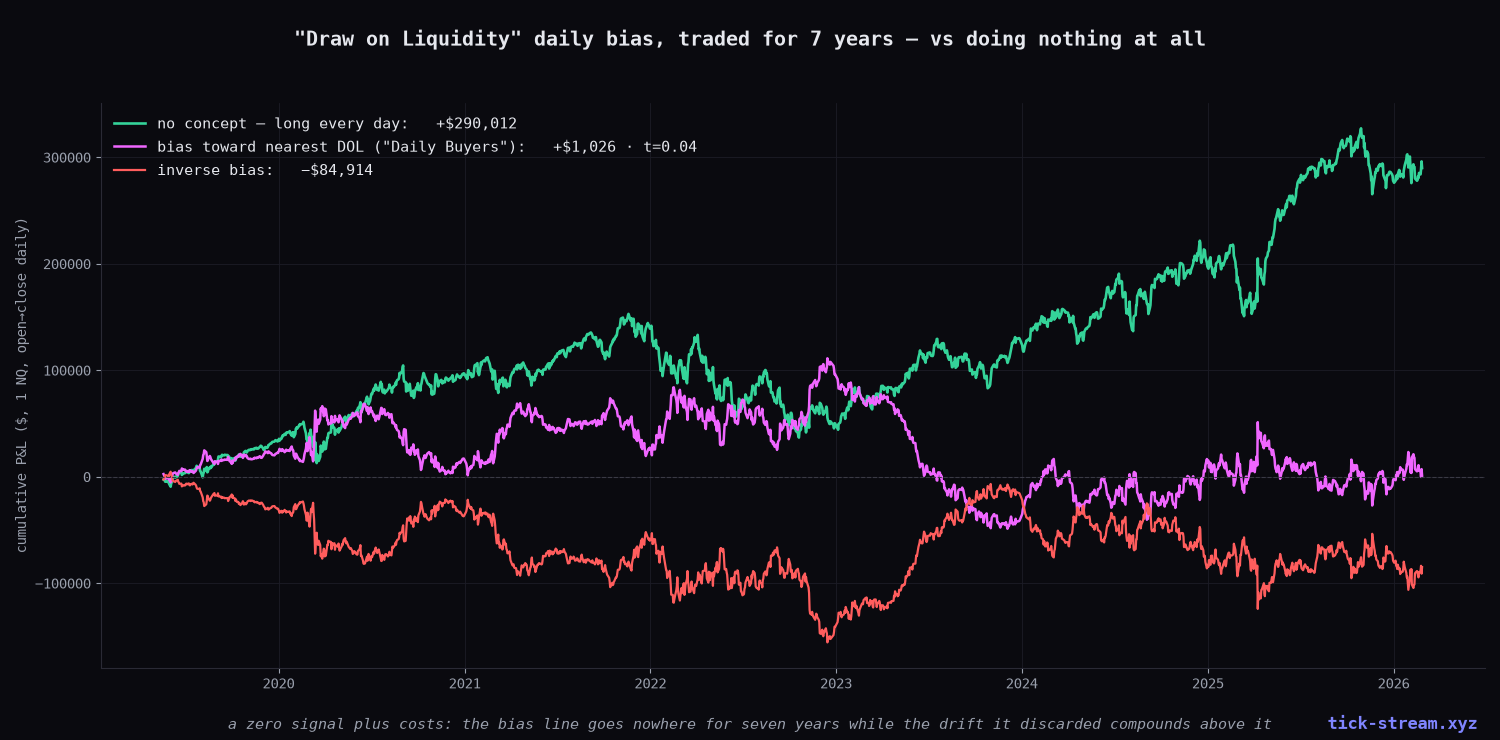
The bias rule doesn’t merely fail to find the Daily Buyers. It takes the one real, free ingredient in the data — the index drift — and randomizes you out of it. The distance between “determine the Daily Buyers” and “do nothing” is a quarter of a million dollars, in the wrong direction.
The tell, as always
No control group. Every chart-replay demonstration of a liquidity draw shows you the 90% — price reaching a nearby level — and never shows you that a random number at the same distance gets “collected” just as often. Ask one question of any magnet claim: how often does price reach a non-special level at the same distance? In every family we’ve tested, that single question is where the concept ends.
Methodology: NQ, 1,770 Globex trading days (18:00→17:00 ET) 2019-03 → 2026-02, daily OHLC from real trade prints. DOL detection fully ex-ante (levels from prior days only, activity checked through the prior close): equal extremes within 0.05% (relative 0.12%), 40-day lookback; unmitigated daily FVGs per the three-candle definition. Touch test: level reached within K=10 days, ATR(14)-normalized distances, base rate from a grid of arbitrary levels at 0.25–3 ATR on every day, binomial z per distance bin. Parameter grid (tight/primary/wide) reported — same shape in all. Bias trade: open→close daily, $14.50 RT + 2 ticks. Session coverage per house rule: daily/HTF claim — full-Globex daily bars; intraday session pass N/A.
Frequently asked questions
Does price really get 'drawn' to liquidity levels like equal highs and equal lows?
Not in our measurement. Across 1,770 NQ trading days we tracked every active equal-high/low cluster and unmitigated daily fair value gap, and asked how often price touched it within ten days — compared against arbitrary levels at the exact same ATR-normalized distance. Nearby levels: 90.3% touch rate vs 89.2% base rate (statistically nothing). Distant levels: significantly BELOW base rate (z-scores to −5.5). The 'magnet' attracts price less than a random number at the same distance.
Why would unmitigated levels be touched LESS often than random prices?
Because the condition selects for avoidance. 'Unmitigated' or 'active' means the market has already spent days or weeks NOT going there — you are conditioning on exactly the levels price has been moving away from. Survivorship is built into the concept: the longer a draw stays 'open', the more likely it marks a direction the market has abandoned, not a target it is working toward.
Can Draw on Liquidity determine the daily bias ('Daily Buyers')?
No. Trading each day open-to-close toward the nearest active liquidity draw over seven years produced +$1,026 total — a t-statistic of 0.04, a coin flip after costs. The inverse loses too (−$84,914 — costs eat both sides of a zero signal). Meanwhile the control with no concept at all — simply long every day — made +$290,012 over the same window. The bias rule doesn't just fail to add information; it randomizes you out of the index drift.
Is this the same as other ICT/SMC concepts you've tested?
It's the same family and the same result, now measured four independent ways: untouched levels hold worse, not better (the no-defender inversion); level-touch 'reactions' are base rate; sweep-reversals fail placebo controls; and now draws-on-liquidity touch at or below base rate. Across order blocks, FVGs, sweeps, key zones, HVNs and gamma walls, the consistent finding is that the edge — where one exists — lies away from levels, not at them.
What's the honest takeaway for a retail trader?
Any claim of the form 'the market tends to return to X' is testable with one control: measure how often it returns to a random price at the same distance. In every level family we've run that control on, the special level performs like — or worse than — the random one. If a video sells you a magnet without showing you that control, the magnet is the marketing.