Hidden Markov Model Trading: Regime Detection Only Works When It Sees the Future
HMM regime detection is the most convincing-looking strategy in quant trading: fit a hidden Markov model on daily returns, go long in the bull state, flat in the bear state — and the backtest prints Sharpe 1.84 while sitting out the entire 2022 bear. We rebuilt it honestly on 7 years of NQ: walk-forward, filtered states only, real switching costs. Sharpe drops to 0.59 — below buy-and-hold. The gap is pure lookahead, and it's hiding in one word: smoothed.
Of everything we’ve backtested for this blog, the hidden Markov model produced the most seductive fake result — and the cleanest demonstration of why it’s fake. If you read one article before believing any “machine-learning regime detection” pitch, make it this one.
The idea is elegant. Markets switch between hidden regimes — a calm bull state and a volatile bear state. A 2-state Gaussian HMM can infer, from daily returns alone, which state each day belongs to. Strategy: long in the bull state, flat in the bear state. Every quant tutorial builds this; every backtest of it looks incredible.
Ours did too — until we removed the time machine.
One stat does the judging below: t (the t-statistic) measures how far an average sits above zero relative to its own noise — |t| above 2 is a real effect, between −2 and +2 is noise.
The version everyone posts: Sharpe 1.84
Fit the HMM on the full seven-year history, compute smoothed state probabilities, trade the states:
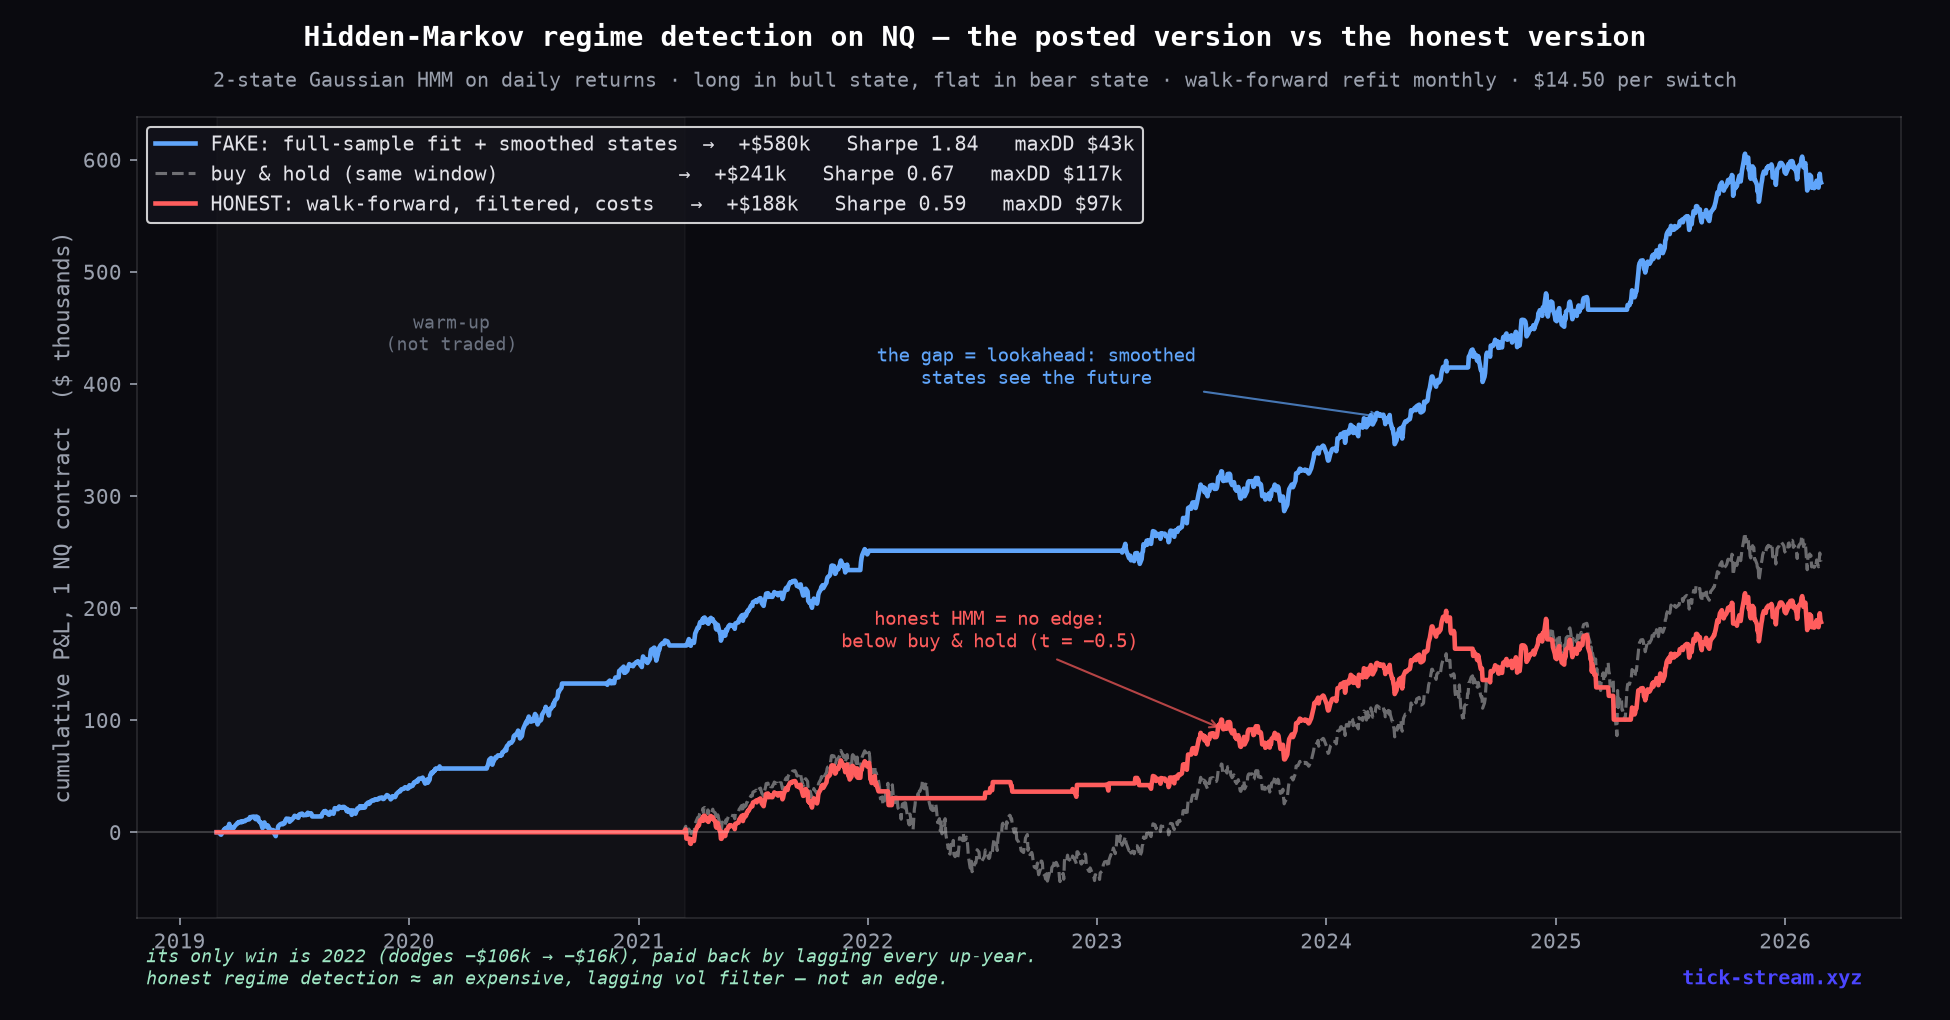
+$580k on one contract, Sharpe 1.84, max drawdown $43k, only 19 elegant regime switches. It sits in cash through virtually the entire 2022 bear and rides every rally. If you saw this pitched — as a course, a signal service, or a GitHub notebook — it would look like the most robust thing you’d ever seen.
It contains the future twice:
- The fit knows the whole history. The model’s parameters — what “bear regime” even means — were estimated on data that includes 2022. It isn’t detecting the bear; it’s remembering it.
- Smoothed states are backward-looking by construction. The forward-backward algorithm computes P(state on day t | all data, including every day after t). The word “smoothed” sounds innocent; it literally means conditioned on the future.
The honest version: below buy-and-hold
Same model, same rule, no time machine: expanding-window fit that ends at day t, refit monthly, filtered probabilities only (forward pass, data ≤ t), position taken at t+1, $14.50 per switch.
| Net | Sharpe | maxDD | Switches | |
|---|---|---|---|---|
| FAKE (smoothed, full-sample) | +$580k | 1.84 | $43k | 19 |
| Buy & hold (same window) | +$241k | 0.67 | $117k | — |
| HONEST (filtered, walk-forward) | +$188k | 0.59 | $97k | 65 |
The honest HMM underperforms doing nothing (daily-difference t = −0.5 — noise, leaning negative). The Sharpe gap between the two versions — 1.84 to 0.59 — is pure lookahead. Nothing else changed.
Where the model was flat — the picture that explains everything
Shade the days each version sat out of the market:
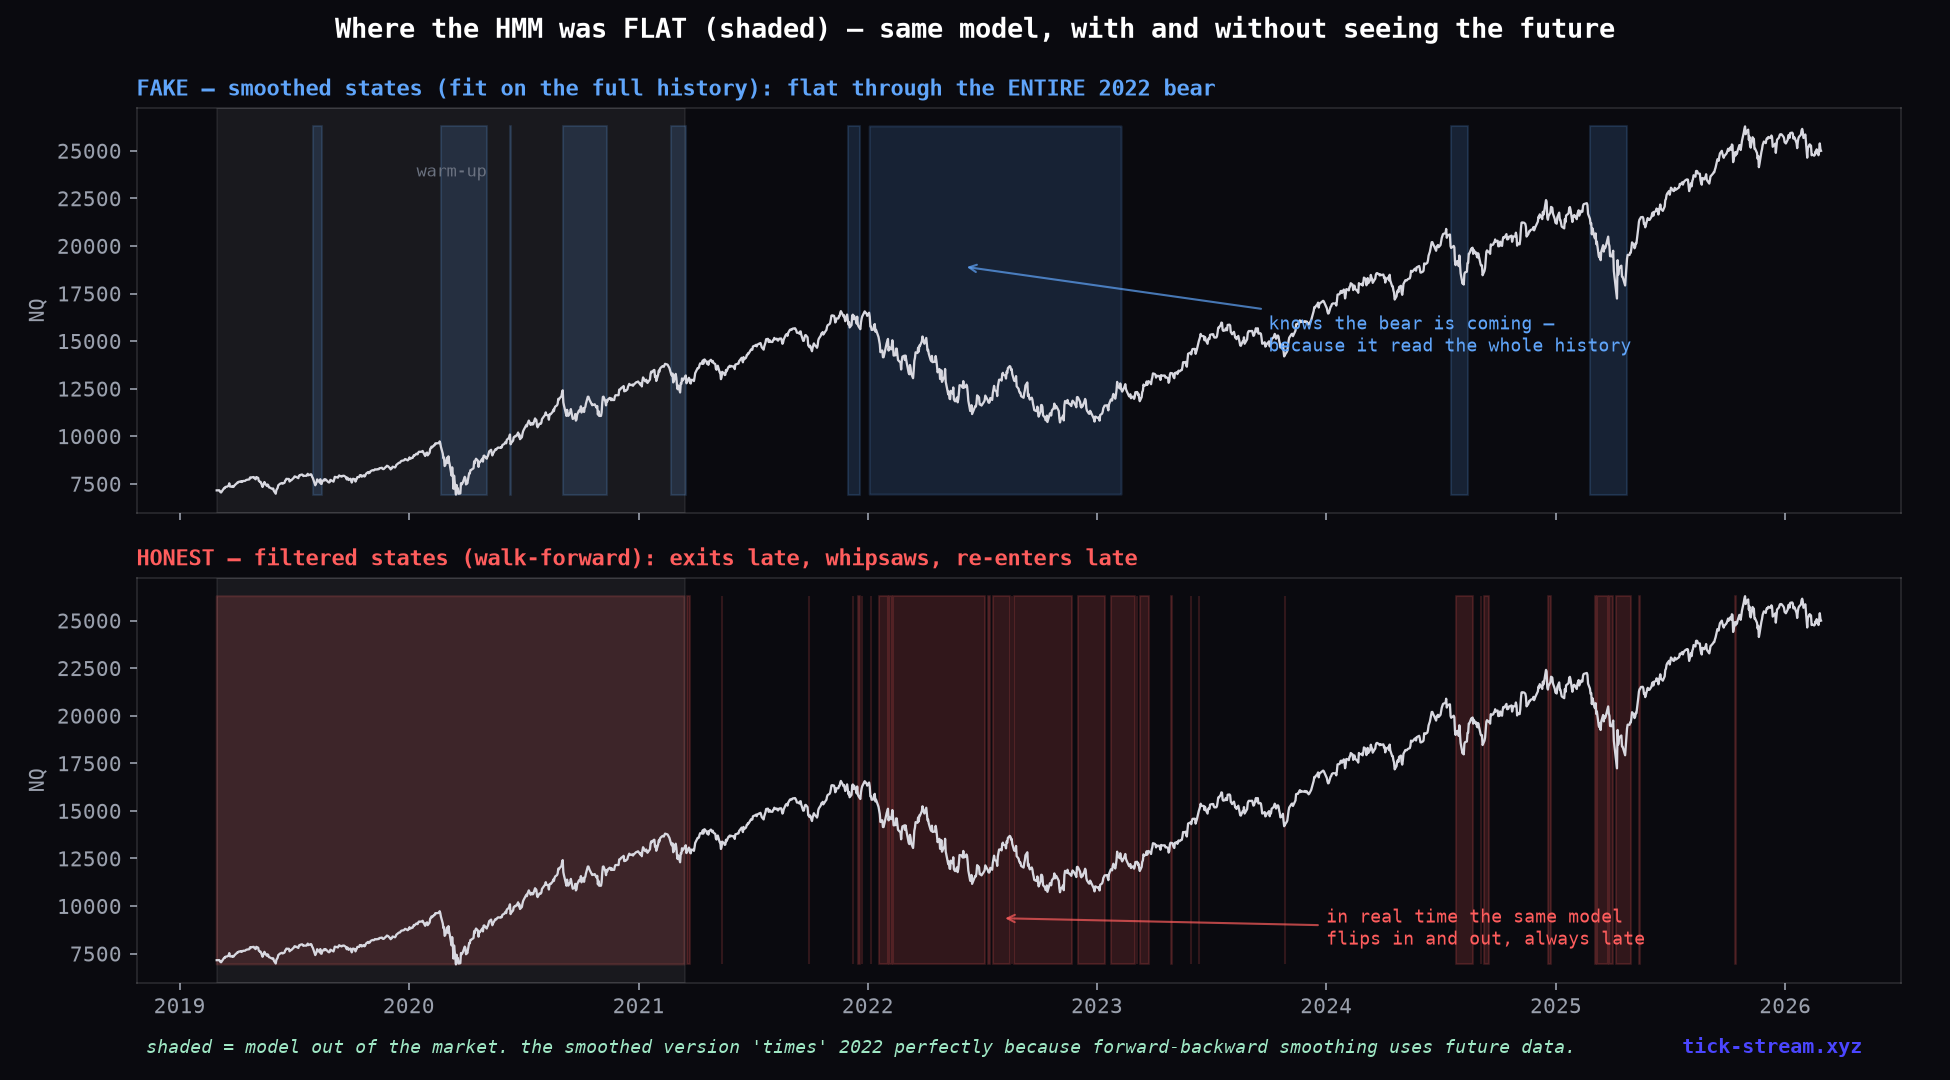
The fake version’s flat period is one clean block laid perfectly over the 2022 bear — of course it is; the smoothing pass could see both edges of the bear when labeling every day inside it. The honest version is what regime detection actually looks like in real time: it exits after the damage has started, flips back and forth through every choppy stretch (65 switches vs 19), and re-enters after the recovery is underway. Always late, because in real time a regime is only obvious once it’s been happening for a while — and by then you’ve eaten the move.
The year-by-year makes the trade-off explicit: the honest HMM’s only winning year is 2022 (−$16k vs buy-and-hold’s −$106k — the vol filter genuinely helped). It then lags roughly half of every up-year: 2023 ($79k vs $121k), 2024 ($34k vs $83k), 2025 ($41k vs $85k). One dodged bear, paid for with three muted bulls. Net: less money, lower Sharpe, moderately lower drawdown — an expensive, lagging volatility filter.
Why regime detection keeps failing this test
This is the third regime-timing approach we’ve killed with the same methodology — day-type classifiers and volatility-targeting overlays came first. The structural reason is always the same: a regime detector is a second prediction stacked on top of the first. You now need enough data to validate the edge and the switching rule and their interaction — and one history of one index contains maybe two real bear markets. Whatever you fit will be a description of those two bears, not a forecast of the third. (A reader once put it perfectly: “a lot of ‘regime detection’ is glorified overfitting.” Our numbers agree.)
What actually survives, in our book, is much less glamorous: don’t predict the regime — diversify across it. Uncorrelated strategy styles (mean reversion, trend, breakout) cushion each other precisely because different regimes favor different sleeves, no forecast required. That, plus at most a coarse volatility gate at the book level, has beaten every clever switcher we’ve tested.
The transferable lesson
“Smoothed” is the regime-detection version of the same-bar fill artifact and the one-line lookahead bug: a technically-correct-sounding default that quietly imports the future into your backtest. If you’re evaluating any regime model — HMM, clustering, ML classifier — ask two questions: was it fit only on data before the period being scored, and does the day-t signal use only data ≤ t? If either answer is no, the equity curve is partly fiction. Ours went from 1.84 to 0.59 on those two questions alone.
Methodology: NQ daily closes 2019–2026 (1,727 sessions), 2-state Gaussian HMM (own EM implementation, no library magic), long in the risk-on state / flat otherwise, 1 contract. Fake arm: single fit on the full sample, smoothed (forward-backward) probabilities. Honest arm: expanding-window fit ending at day t, refit every 21 sessions (500-day warm-up, untraded), filtered (forward-only) probabilities, position at t+1, $14.50 per switch. Buy-and-hold benchmarked over the identical evaluated window. Daily-aggregated t-stats.
Frequently asked questions
Does hidden Markov model regime detection work for trading?
Not in its honest form, in our testing. A 2-state Gaussian HMM on NQ daily returns — long in the bull state, flat in the bear state — earned a 1.84 Sharpe when fit on the full history with smoothed states. Rebuilt honestly (walk-forward refits, filtered state probabilities that only use data available at the time, costs per switch), the same model earned a 0.59 Sharpe — below buy-and-hold's 0.67 over the same window, with a daily-difference t-stat of −0.5. The spectacular version is lookahead; the real version is an expensive, lagging volatility filter.
What is the difference between smoothed and filtered HMM states?
Filtered probabilities answer 'what state am I in, given data up to today?' — that's what you can actually know in real time. Smoothed probabilities answer 'what state was I in on day t, given the ENTIRE dataset including everything that came after?' — the forward-backward algorithm explicitly uses future observations. Nearly every HMM trading tutorial fits on the full sample and plots smoothed states, which means the model 'detects' the 2022 bear partly because it has already seen how 2022 ends. It's lookahead bias wearing a fancy name.
Why does the honest HMM underperform buy-and-hold?
Because a regime detector is a second prediction stacked on top of the market, and in real time it's always late. In our walk-forward test its single good year was 2022 — it dodged most of the bear (−$16k vs −$106k for buy-and-hold) — but it paid that back by lagging roughly 50% behind in every up year (2023–2025), plus 65 switch costs and whipsaws. Net effect: less total profit, slightly lower Sharpe, moderately lower drawdown. That's a volatility filter you overpaid for, not an edge.
Is regime detection completely useless then?
As a standalone timing strategy, we haven't found a version that survives honest testing — HMMs here, and previously day-type classifiers and volatility-targeting overlays, all failed out-of-sample or turned out to be artifacts. What has survived in our work is much cruder: diversifying across uncorrelated strategy styles (so the regime question stops mattering trade-by-trade), and at most a coarse book-level volatility gate. If your edge only exists after a regime filter, you usually don't have an edge — you have a curve fit to one bear market.
How do you backtest an HMM without lookahead?
Three rules. Fit on an expanding window that ends at day t — never on the full sample. Use FILTERED state probabilities (forward pass only, data ≤ t) for the trading decision, never smoothed ones. And act on the signal at t+1, paying realistic costs for every regime switch. Also refit periodically (we refit monthly), because a model fit once on early data quietly degrades. Each of these steps removes a specific flavor of future information; skip any one of them and your Sharpe is partly fiction.