The Put/Call Ratio That Works on ES Is Not the One Everyone Quotes
We re-ran our surviving options contrarian on the S&P: 1,789 sessions of our own SPY chain recording, traded on the next ES cash session. Put/call VOLUME beyond 1.5 sigma pays $432.65 a trade at t = 2.43, and it beats a control matched for yesterday's range. Put/call OPEN INTEREST — the ratio most sites publish — returns −$31.40 a trade at t = −0.43. The holdout half does not confirm the winner, so it is a candidate, not a sleeve.
Put/call volume beyond 1.5 standard deviations, faded on the next ES cash session, returned $432.65 a trade over 215 trades at t = 2.43. Put/call open interest — the ratio that appears on most free sentiment dashboards — returned −$9.22 a trade at the same threshold, t = −0.08.
This is one of the few options findings that survived our Nasdaq testing, so the point of this run was to see whether it travels to the S&P. It replicates. It survives the control we built specifically to kill it. And the out-of-sample half does not confirm it, which is why it is logged as a candidate and nothing more.
The data, once
1,789 sessions of SPY option chains, recorded by us from OPRA, 2019-04-04 to 2026-05-28. Each day’s ratio is measured against its own trailing quarter and traded on the following ES cash session.
Two limits that shape everything below:
- Open interest is the daily OCC figure. Anything derived from it describes the state at the start of the session, not what happened inside it. That matters for the result, not just the footnote.
- Sessions after 2026-05-29 are excluded. The recorder’s last snapshot of the day is sometimes a truncated post-close chain, and a truncated chain cannot be aggregated honestly. Those rows are dropped rather than quietly averaged in.
The rule
- Compute put/call volume and put/call open interest from the full SPY chain each session.
- Z-score each against its own trailing 60-session mean and standard deviation.
- Trade it contrarian, both sides: too many puts → long the next ES cash session, too many calls → short it.
- Enter at the next session’s cash open, exit at its close. One contract, no stop, no filter.
- Three thresholds: 1.0, 1.5 and 2.0 standard deviations.
The baseline, because everything has to beat it
Long one ES contract every session, same hold, same costs:
| Long every day | |
|---|---|
| Trades | 1,789 |
| Win rate | 53.7% |
| Average per trade | $24.87 |
| Total | $44,487 |
| Profit factor | 1.037 |
| Max drawdown | $45,291 |
| Sharpe | 0.20 |
| t | 0.53 |
| p | 0.5960 |
That is the drift, and over seven years it is not significant. Any signal that ends up near $24.87 a day has found nothing but the market.
Six cells
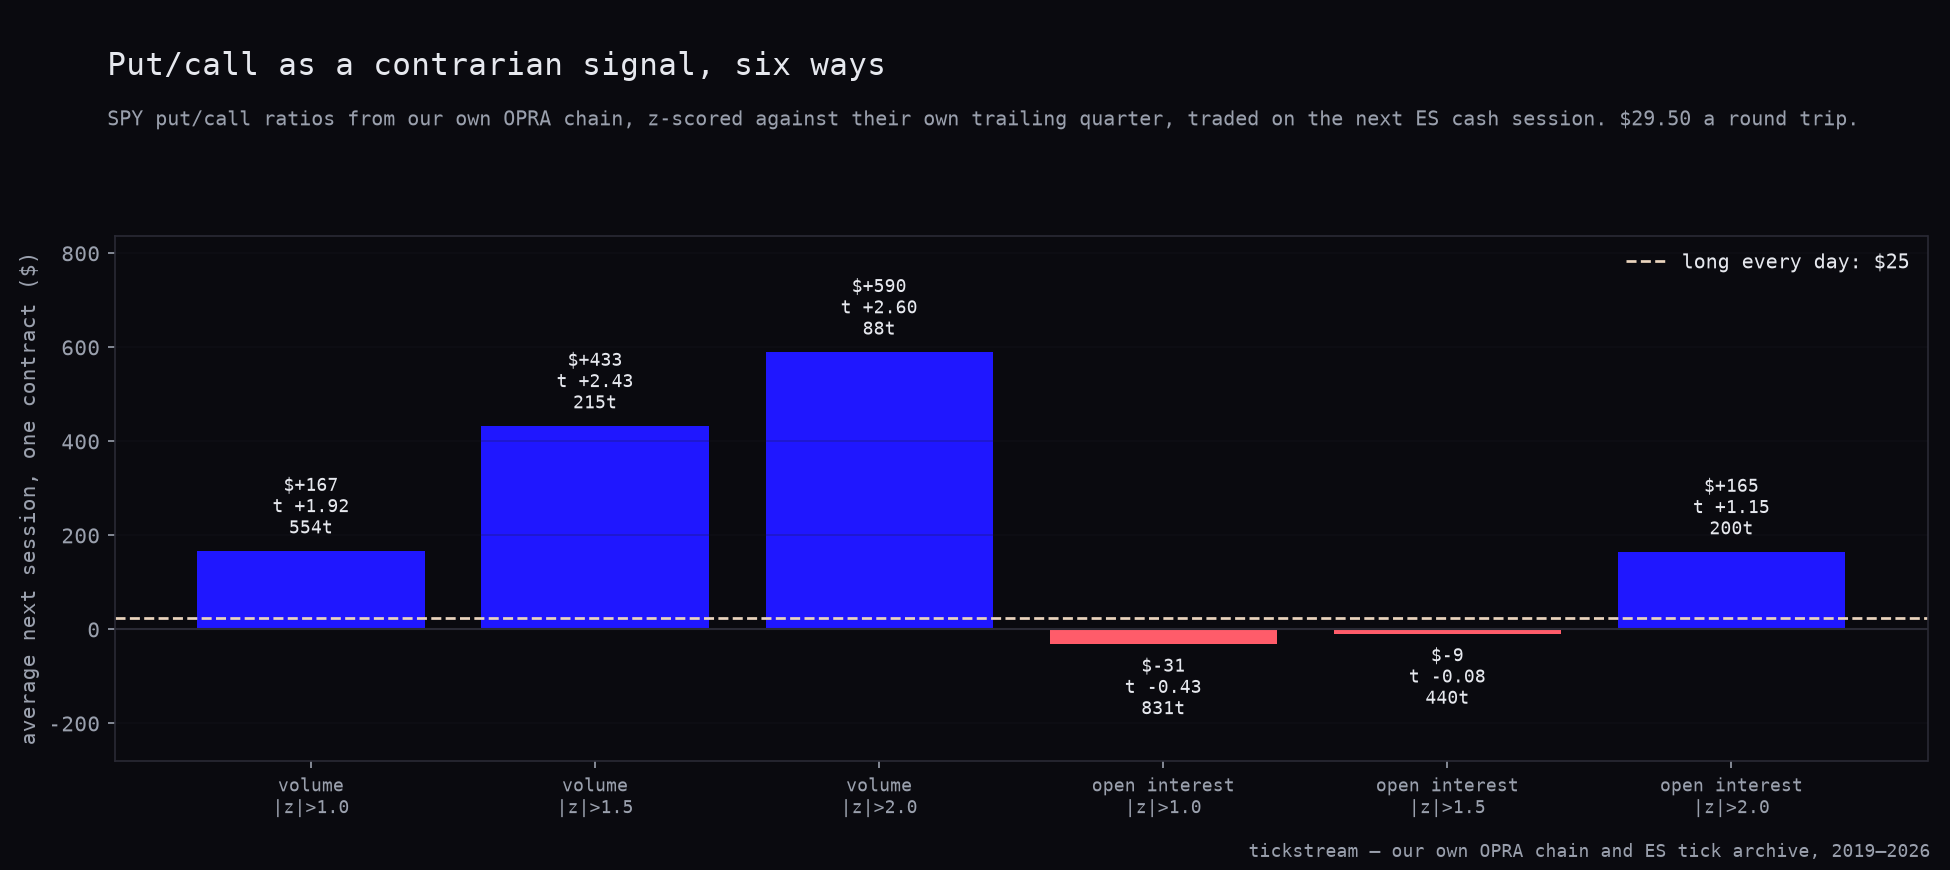
The chart below is the whole grid at a glance: the average next session for each of the six cells, with the long-every-day baseline drawn across as the dashed line. The three volume bars sit above it and grow with the threshold. The three open-interest bars do not.
The numbers, both sides combined:
| Signal | Trades | Put-heavy / call-heavy | Win rate | Average | Total | PF | Sharpe | t | p |
|---|---|---|---|---|---|---|---|---|---|
| Volume, 1.0σ | 554 | 291 / 263 | 54.0% | +$166.71 | +$92,357 | 1.29 | 1.29 | 1.92 | 0.0556 |
| Volume, 1.5σ | 215 | 173 / 42 | 57.7% | +$432.65 | +$93,020 | 1.80 | 2.63 | 2.43 | 0.0158 |
| Volume, 2.0σ | 88 | 82 / 6 | 62.5% | +$589.53 | +$51,879 | 2.35 | 4.40 | 2.60 | 0.0110 |
| Open interest, 1.0σ | 831 | 442 / 389 | 49.2% | −$31.40 | −$26,090 | 0.96 | −0.24 | −0.43 | 0.6669 |
| Open interest, 1.5σ | 440 | 235 / 205 | 50.5% | −$9.22 | −$4,055 | 0.99 | −0.06 | −0.08 | 0.9348 |
| Open interest, 2.0σ | 200 | 110 / 90 | 48.5% | +$164.69 | +$32,938 | 1.26 | 1.30 | 1.15 | 0.2499 |
Volume behaves the way a real signal behaves: more extreme reading, bigger payoff, and the t statistic rises with the threshold rather than falling as the sample thins. Open interest sits on zero at 1.0σ and 1.5σ, and its only positive cell at 2.0σ comes with t = 1.15 and a 48.5% win rate — a below-even hit rate carried by a handful of large moves.
So the ratio most sites quote is the one that does not work. That is not a subtle result. It is the difference between measuring what people did today and measuring where they already sat this morning.
The caveat that matters more than the p-values
The sample is badly one-sided at the extremes. At 2.0σ there are 82 put-heavy days against 6 call-heavy days. The short side of that row is six observations, and six observations are not a result — no matter what profit factor they print. We are not quoting it as one.
The same skew is visible at 1.5σ (173 against 42). Only the 1.0σ row has genuinely balanced counts, 291 against 263, and there both sides have enough trades to be read. Everything we conclude below leans on the 1.0σ and 1.5σ rows for that reason, and the headline 2.0σ average of $589.53 is best treated as the put-heavy side with a rounding error attached.
The obvious objection
Extreme put/call readings do not arrive on quiet days. They arrive after a drop, when the tape is loud — and loud days mean-revert. So the objection writes itself: this is a volatility signal wearing a direction costume.
We built the control for exactly that. For every signal day we took the same trade on an ordinary day (|z| ≤ 0.5) matched for yesterday’s range. The two pools really are matched: signal days average 53.83 points of prior range, the ordinary pool 53.43 points.
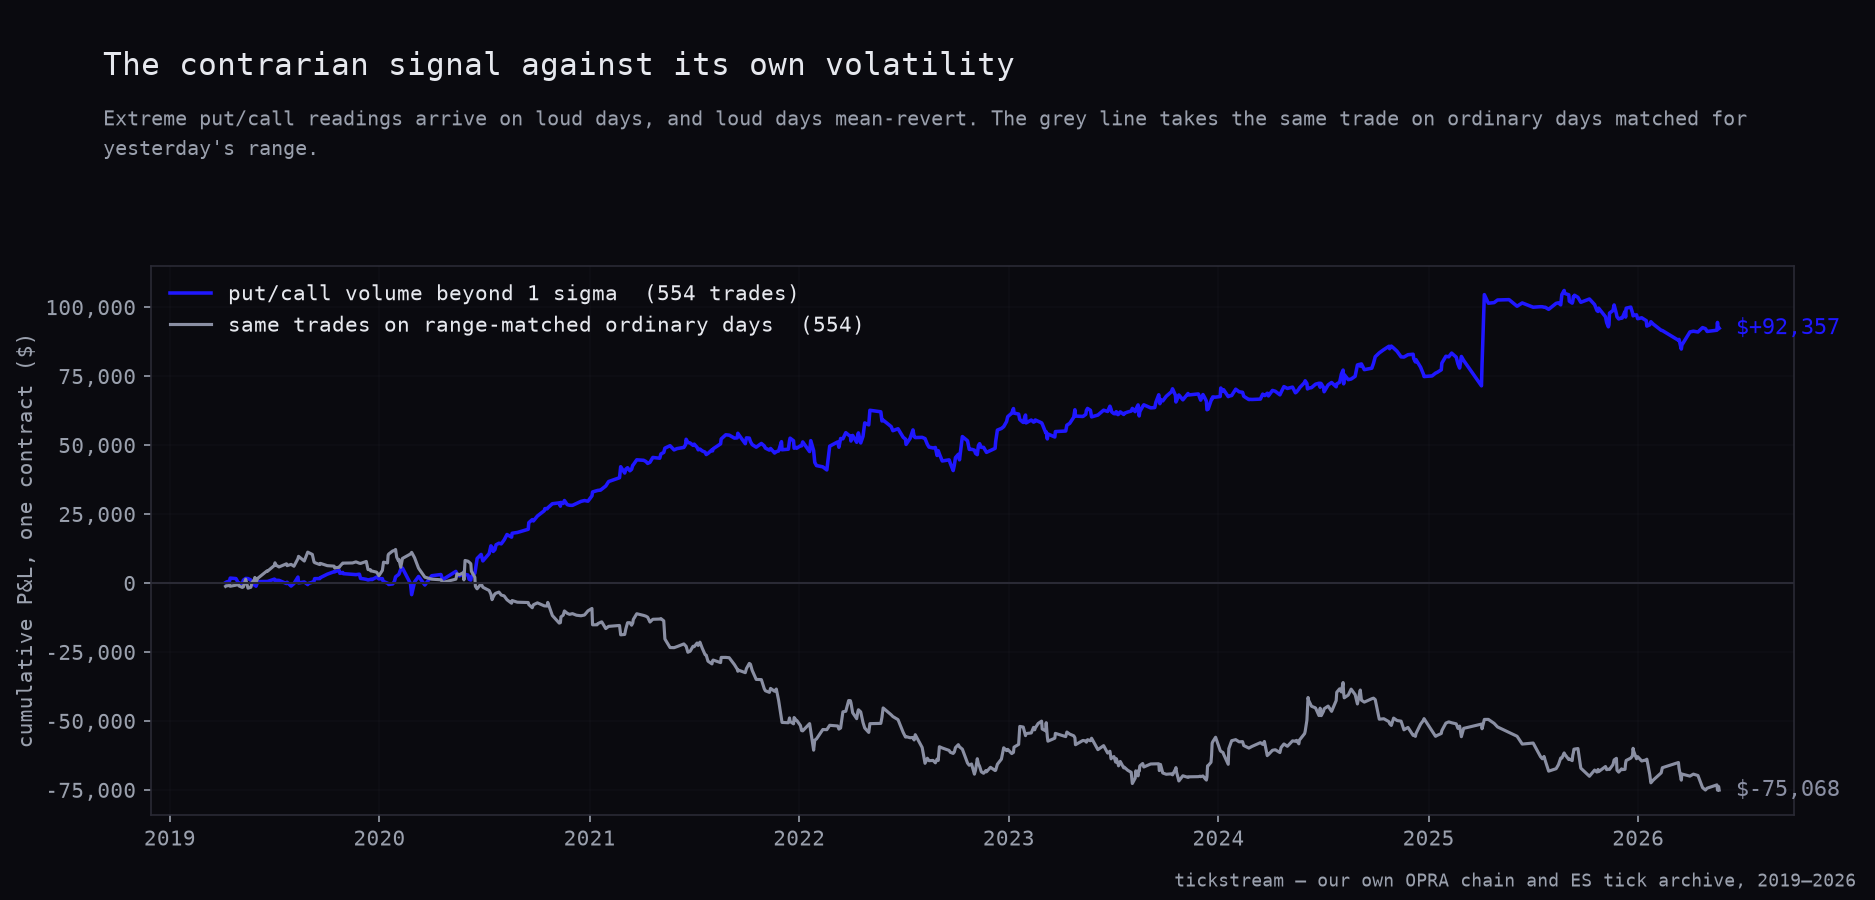
The blue line below is the 1.0σ signal, both sides. The grey line is the identical trade taken on those range-matched ordinary days.
| Signal, 1.0σ | Range-matched control | |
|---|---|---|
| Trades | 554 | 554 |
| Win rate | 54.0% | 49.1% |
| Average per trade | +$166.71 | −$135.50 |
| Total | +$92,357 | −$75,068 |
| Profit factor | 1.29 | 0.83 |
| Sharpe | 1.29 | −1.08 |
| t | 1.92 | −1.61 |
| p | 0.0556 | 0.1090 |
Be careful with how strong that claim is. The control’s t is −1.61 at p = 0.1090, which is not significantly negative. The honest statement is that the signal beats a matched control that shows nothing — not that trading ordinary loud days is a reliable way to lose money. The gap between the two lines is the signal’s contribution; the grey line’s slope is not itself a finding.
Coincident versus forward
This is the separation we make in every order-flow test in this series, and it is the reason we trust the third column below and not the first.
| Correlation | r | p | n |
|---|---|---|---|
| Put/call volume vs same day’s ES move | −0.4820 | 0.0000 | 1,789 |
| Put/call volume vs next day’s ES move | +0.0659 | 0.0053 | 1,789 |
| Put/call open interest vs next day’s ES move | −0.0088 | 0.7097 | 1,789 |
The first number is enormous and completely useless. An r of −0.4820 says people buy puts while price is falling, which is a description of the day you are already sitting in. Charted, it makes options flow look like a crystal ball. Traded, it is unavailable — the move it correlates with is over.
The second number is small, real, and points the contrarian way: heavy put volume today, positive drift tomorrow, p = 0.0053. Small and forward beats large and coincident every time. The third number, open interest against tomorrow, is r = −0.0088 at p = 0.7097. That is nothing, and it agrees with the grid.
The part that stops us deploying it
Split at 2023, on the 1.0σ signal:
| Train 2019–2022 | Holdout 2023–2026 | |
|---|---|---|
| Trades | 288 | 266 |
| Win rate | 54.5% | 53.4% |
| Average per trade | +$209.39 | +$120.50 |
| Total | +$60,304 | +$32,053 |
| Profit factor | 1.41 | 1.19 |
| Sharpe | 1.92 | 0.82 |
| t | 2.05 | 0.84 |
| p | 0.0411 | 0.4018 |
The sign holds. The significance does not. A holdout at p = 0.4018 is not a confirmation, and we do not treat it as one.
Year by year makes the reason visible:
| Year | P&L, one contract |
|---|---|
| 2019 | +$1,502 |
| 2020 | +$28,159 |
| 2021 | +$19,249 |
| 2022 | +$11,395 |
| 2023 | +$7,083 |
| 2024 | +$7,460 |
| 2025 | +$20,977 |
| 2026 | −$3,466 |
2020 alone contributes $28,159 of the $92,357 total. A signal whose best year is the pandemic is a signal that needs a longer archive than seven years to be judged, and seven years is all we have here.
That is the standing limit of the options half of this series. Our own ES tick archive reaches back to 2014 and lets us put twelve and a half years behind a price-based rule. Our OPRA chain store starts in 2019. Every options finding on this blog is therefore judged on roughly half the history we can bring to a futures one, and this article is a clean example of what that costs: the same result over twelve years would be either a deployment or a kill, and over seven it is neither.
What we did with it
Logged as a candidate. Not deployed.
The volume version passed its replication, passed its control, and passed the coincident/forward separation that kills most options ideas we test. It failed the split, and the split is where we stop. Nothing goes live from a backtest here — a candidate earns a paper sleeve first, and a paper sleeve earns capital after that, or it does not.
The genuinely useful takeaway is cheaper than the strategy: if you read a put/call ratio at all, read the volume one. The open-interest version returned −$31.40 a trade at 1.0σ, and it is the one printed on the dashboards.
Related: RSI-2 dip buying on twelve years of ES — the Nasdaq version of this options signal was orthogonal to that sleeve, which is what made it worth re-testing. Dealer gamma on ES covers the other half of the options book: regime, not direction. And Counterflow is the NQ positioning contrarian this test was derived from.
Method: 1,789 sessions, 2019-04-04 to 2026-05-28. SPY option chains from our own OPRA recording; open interest is the daily OCC figure and therefore describes the start of the session. Sessions after 2026-05-29 are excluded because the recorder’s final snapshot is sometimes a truncated post-close chain. Trades are taken on the ES cash session, New York time, one contract, entry at the open and exit at the close. Costs are $4.50 commission plus two ticks of slippage per round trip, which on ES is $29.50, and they are subtracted from every trade above. Z-scores use a trailing 60-session window. The range-matched control draws from days with |z| ≤ 0.5, matched on the prior session’s range.
Frequently asked questions
Does the put/call ratio actually predict the next day on the S&P?
The volume version does, weakly. Beyond 1.5 standard deviations from its own trailing quarter, traded contrarian on both sides, it produced 215 trades at $432.65 each, $93,020 total, t = 2.43, p = 0.0158. For comparison, simply holding one ES contract every session over the same 1,789 days made $24.87 a day at t = 0.53.
Why does put/call open interest fail when put/call volume works?
Open interest is the daily OCC figure, so it describes positioning at the start of the session rather than what traders did during it. Across the same three thresholds it returned −$31.40, −$9.22 and +$164.69 a trade, with t values of −0.43, −0.08 and 1.15. None of that is distinguishable from noise.
Is this just a volatility signal in disguise?
That was our main worry, so we matched every signal day to an ordinary day with the same prior range — 53.83 points on signal days against 53.43 on the matched pool. The same trades on those matched days returned −$135.50 each over 554 trades, t = −1.61, p = 0.1090. The control shows nothing, and the signal beats it.
Why is the signal not running live?
The out-of-sample half does not confirm it. Train 2019–2022 gave $209.39 a trade at t = 2.05; holdout 2023–2026 gave $120.50 at t = 0.84, p = 0.4018. The sign survives, the significance does not, and 2020 alone contributes $28,159 of the $92,357 total.
What is the difference between the coincident and the forward reading?
Put/call volume against the same day's ES move correlates at r = −0.4820, which is a description of the day you are already in — people buy puts while price falls. Against the next day's move the correlation is r = +0.0659 with p = 0.0053. The big number is useless and the small one is the whole finding.