The Intraday Clock on the S&P Has Less In It Than Shuffled Data
We built the half-hour time-of-day table on 3,643 ES sessions from 2014 to 2026. Not one of the thirteen cells clears p = 0.05; the best is 14:30 at t = 1.33, and on 500 shuffles of the same sessions the best shuffled cell averages |t| = 1.97, with 93.2% of shuffles beating our real best. The clock does describe the session's shape — range falls from 14.91 points at the open to 8.41 by 12:30 — and that part is real and useful. We also answered the open lead from our NQ gap study, first-hour momentum on sessions with no gap: on ES it loses $140.86 a session across 264 sessions at t = −1.73.
We built the half-hour time-of-day table on 3,643 S&P futures sessions, the statistic that appears in every intraday course deck, and gave it the significance column it is normally shown without. Not one of the thirteen cells clears p = 0.05. The best of them, 14:30, comes in at t = 1.33.
Then we ran the same thirteen-cell grid on 500 shuffled copies of the same sessions. The best cell on shuffled data averages |t| = 1.97. The real clock has less in it than noise does.
The rule
- ES cash-session minute bars from our own tick archive, New York time, 2 January 2014 to 10 September 2026, 3,643 sessions.
- The session 09:30 to 16:00 is cut into thirteen half-hour slots. Each slot’s move is its last close minus its first open, on one contract.
- Each cell is a hold, not a trade. No cost is charged inside a cell, which flatters every positive number in the table.
- The t-statistic under each cell is one-sample against zero, on that cell’s own series of sessions.
- The multiplicity test permutes each session’s thirteen half-hour returns among themselves, 500 times, and records the largest |t| across the thirteen cells in each shuffled run.
- The first-fifteen-minutes test is a real trade: take the sign of the 09:30–09:45 move, hold from 09:45 to the close, one contract, costed.
- The first-hour test is the same trade one horizon out: take the sign of the 09:30–10:30 move, hold that direction from 10:30 to the close, one contract, costed.
The clock, in full
Here is the whole table rather than the two rows that make a point. Cell counts differ slightly because not every session in the archive carries a complete afternoon.
| Half-hour | Sessions | Mean move | Mean range | Mean volume | Up | t | p |
|---|---|---|---|---|---|---|---|
| 09:30 | 3,266 | +$10.00 | 14.91 | 163,950 | 50.1% | 1.02 | 0.3091 |
| 10:00 | 3,268 | −$0.09 | 13.12 | 124,381 | 50.9% | −0.01 | 0.9921 |
| 10:30 | 3,269 | −$7.03 | 11.46 | 101,066 | 49.3% | −0.90 | 0.3685 |
| 11:00 | 3,264 | +$6.18 | 10.44 | 87,932 | 52.0% | 0.83 | 0.4084 |
| 11:30 | 3,260 | +$5.81 | 9.54 | 75,645 | 50.9% | 0.88 | 0.3766 |
| 12:00 | 3,260 | −$1.27 | 8.80 | 63,241 | 48.6% | −0.21 | 0.8332 |
| 12:30 | 3,244 | +$1.80 | 8.41 | 56,646 | 50.4% | 0.31 | 0.7604 |
| 13:00 | 3,178 | −$3.05 | 8.82 | 57,597 | 49.2% | −0.42 | 0.6737 |
| 13:30 | 3,148 | +$6.27 | 8.43 | 56,095 | 49.7% | 0.98 | 0.3293 |
| 14:00 | 3,135 | −$0.31 | 9.46 | 66,602 | 51.1% | −0.05 | 0.9637 |
| 14:30 | 3,137 | +$9.11 | 9.34 | 66,584 | 51.6% | 1.33 | 0.1832 |
| 15:00 | 3,135 | −$1.49 | 9.64 | 74,616 | 50.3% | −0.21 | 0.8305 |
| 15:30 | 3,125 | −$5.68 | 12.19 | 165,104 | 49.0% | −0.61 | 0.5446 |
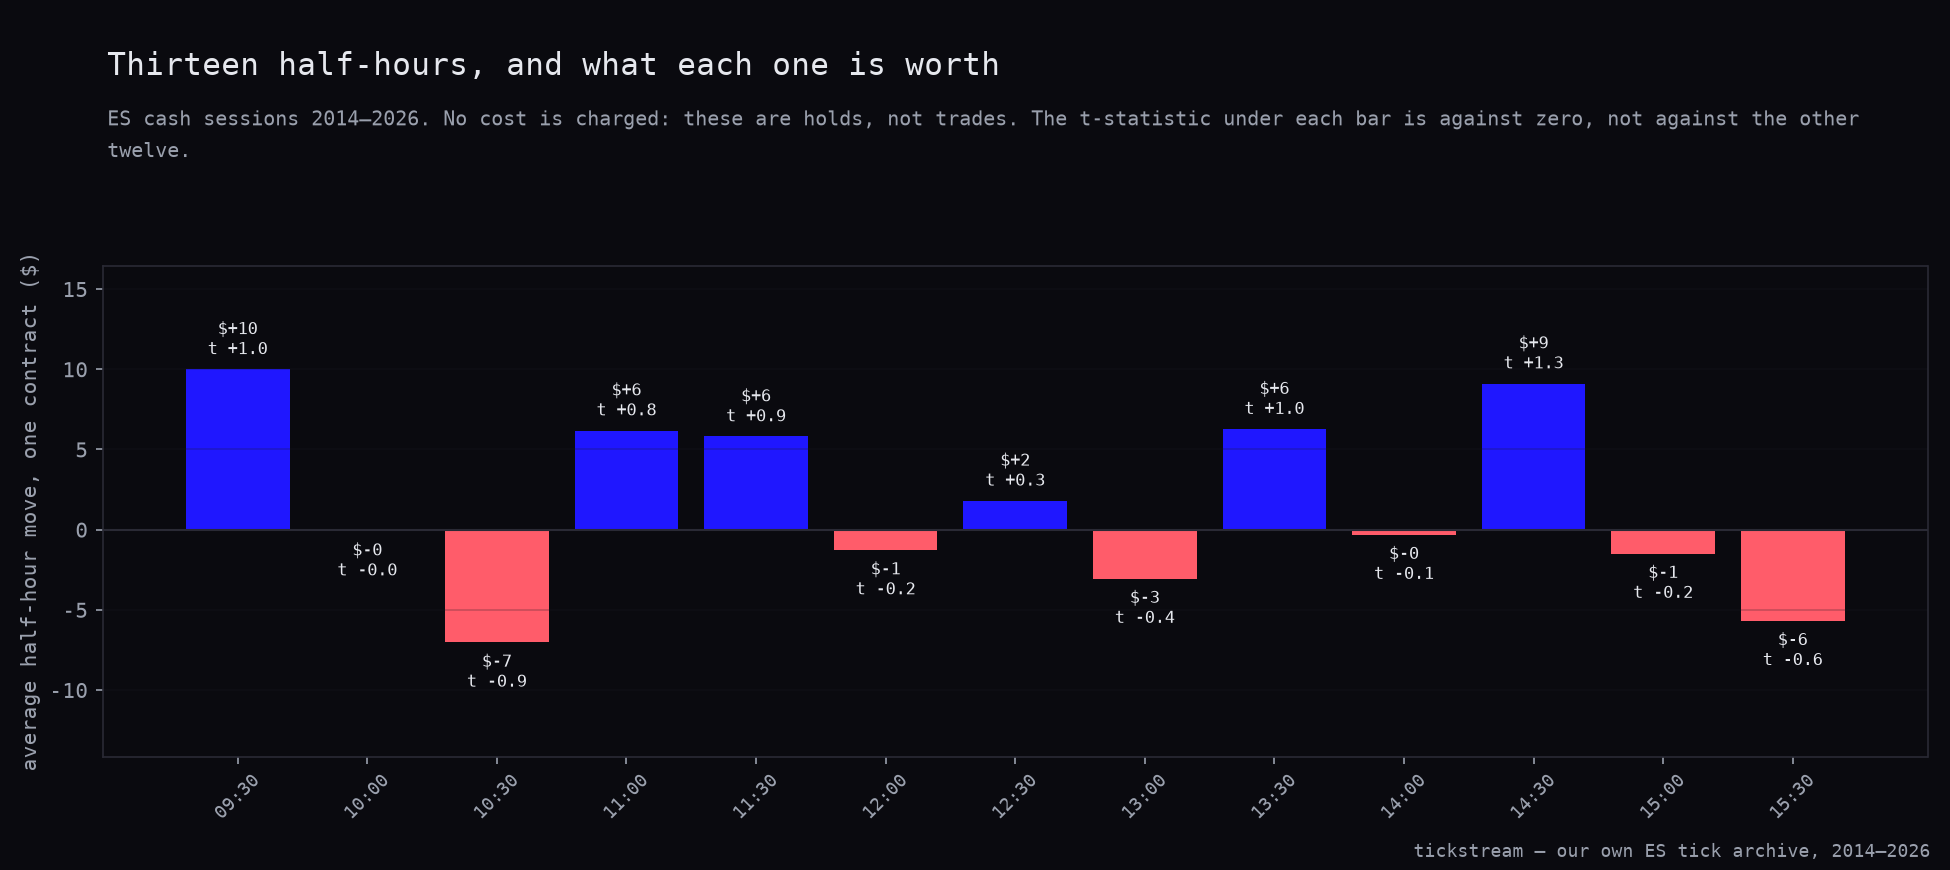
The largest cell is the opening half-hour at $10.00. The worst is 10:30 at −$7.03. Every up-rate in the column sits between 48.6% and 52.0%, which is the range you get from three thousand coin flips.
Say the cost thing out loud, because it matters more here than the p-values do. These are holds. A trader cannot own a half-hour cell without entering and exiting it, and a round trip on ES is $29.50. The biggest number in the table is $10.00. Even before significance enters the argument, the best-looking cell in the clock nets −$19.50, which is a tick and a half handed to the broker and the spread.
The chart puts the thirteen cells side by side with their t-statistics underneath, so the two things can be read together rather than one at a time.
Thirteen cells is thirteen chances
A table of thirteen numbers will always have a largest number. The question is whether the largest number is larger than the largest number you would get from data with nothing in it.
So we took the same sessions, shuffled each session’s thirteen half-hour returns among themselves 500 times, and recorded the biggest |t| in each shuffled grid. That distribution is what “best of thirteen half-hours” looks like when time of day carries no information whatsoever.
| Pricing the thirteen-cell search | |
|---|---|
| Cells tested | 13 |
| Shuffles | 500 |
| Best real cell, absolute t | 1.33 |
| Best shuffled cell, mean absolute t | 1.97 |
| Best shuffled cell, 95th percentile | 2.83 |
| Shuffled runs beating our real best | 93.2% |
Read the last two rows carefully. Our winner would have needed |t| of 2.83 to clear the 95th percentile of the noise distribution, and it managed 1.33. That is a failure to survive a multiple-testing correction, which is unremarkable.
The remarkable part is the mean. The average shuffled winner is 1.97 and the real winner is 1.33. Shuffle the sessions, keep the best half-hour, and you beat the real table nine times out of ten. The intraday clock does not merely fail to clear the bar. It contains less apparent signal than randomised versions of itself, because the real half-hour returns push against each other in a way that flattens the extremes the shuffles are free to produce.
We ran the identical procedure on the calendar, twenty-two calendar cells against a thousand shuffles, and reached the same verdict from the other direction. There the best real cell at least matched the shuffled average. Here it does not get that far. Same method, different grid, and the grid that gets quoted more often is the weaker of the two.
What the clock does describe
The direction column is empty. The range and volume columns are not, and they are among the most stable patterns anywhere in the archive.
Range falls from 14.91 index points in the opening half-hour to 8.41 by 12:30, then climbs back to 12.19 into the close. Volume traces the same curve harder: 163,950 contracts at the open, down to 56,095 at 13:30, then 165,104 in the final half-hour. The closing cell is the busiest in the session, narrowly ahead of the open.
That is a smile, it repeats every day, and it says nothing about which way price is going. The chart puts both series on the same clock, on paired axes: range in index points on the left, volume in contracts on the right. It has to, because 8.41 and 165,104 do not share a scale.
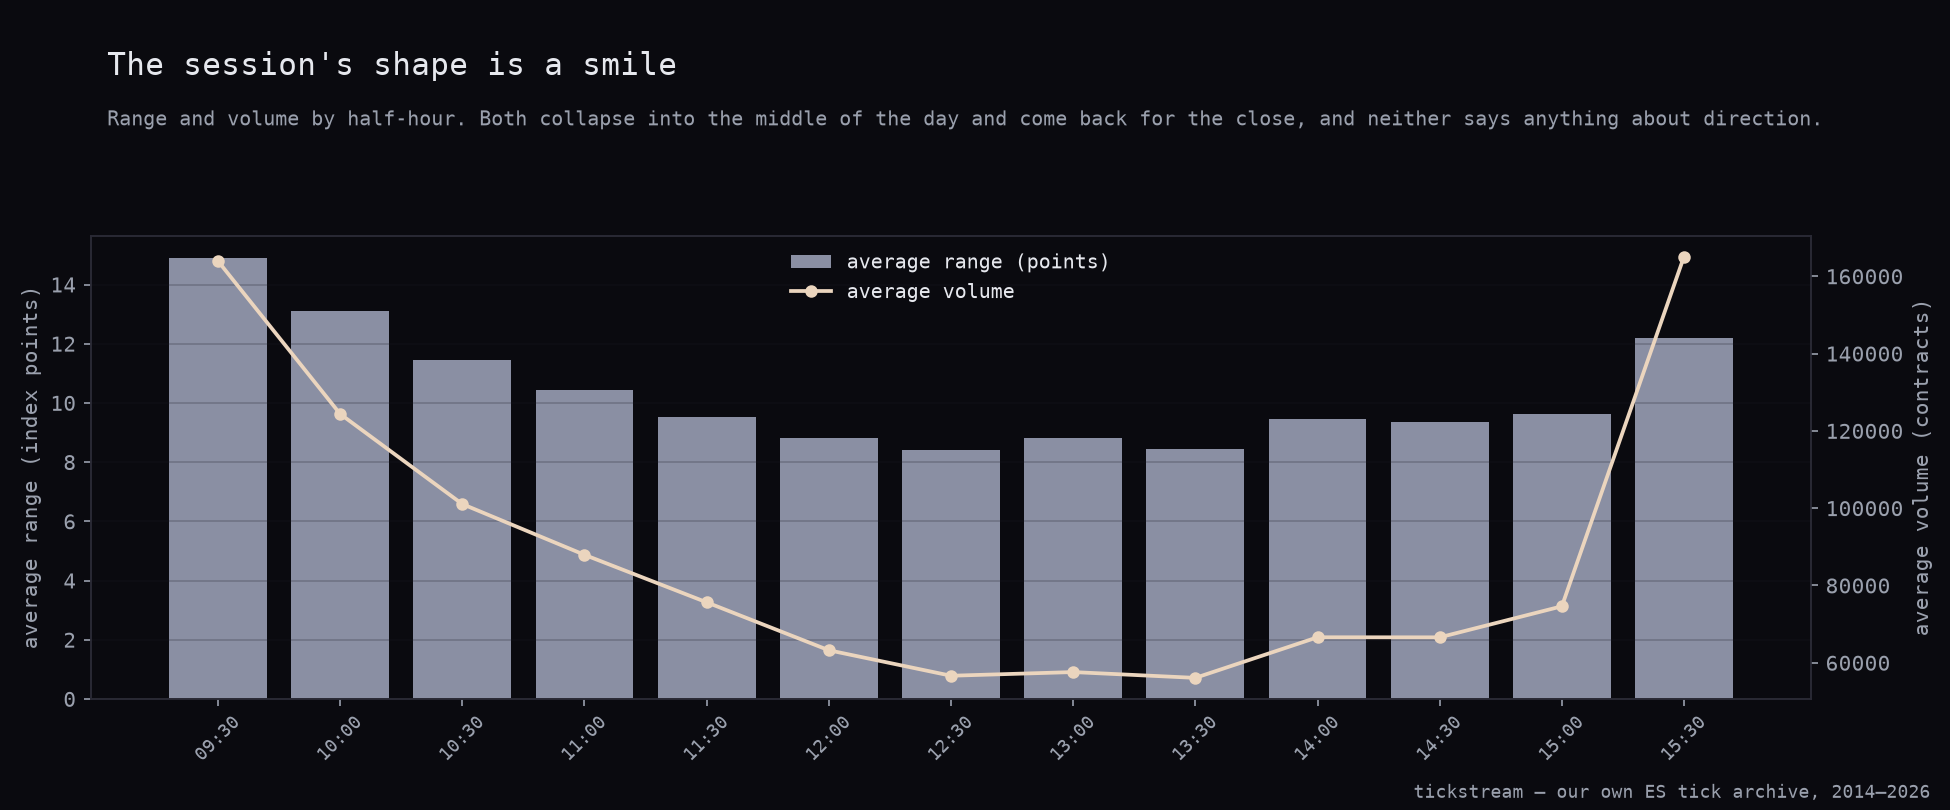
This is the usable part of the time-of-day table, and it is usable for the unglamorous decisions. A stop sized for 14.91 points of typical opening range is loose by nearly half at 12:30 when typical range is 8.41. A position sized on morning volatility is oversized by lunchtime. An order worked into 56,095 contracts of half-hour volume moves the market differently than the same order worked into 165,104.
Sizing, stop distance and when to work an order are real questions with real answers in this table. Which direction to take is not one of them.
The loose end: early-session momentum without a gap
Our NQ gap study ended with one result we flagged rather than buried. Every gap variant was noise, but the control was not. The identical wait-for-the-first-hour rule applied to days with no gap, under 5% of the prior day’s range, made +$118k at t = +2.3 on a fifth of the trades. Our reading there was that the information sits in early-session momentum and the gap adds nothing to it. Those are NQ numbers over seven years. This is the ES test of the same claim, at the same horizon, with the same no-gap control.
It does not replicate. On ES the no-gap cell is not merely flat, it is the worst cell in the table and it points the other way. Take the direction of the first hour on a session that opened without a gap, hold it to the close, and you lose $140.86 a session across 264 sessions at t = −1.73. The rest of the day agrees with the first hour on 45.5% of those sessions. On NQ this was the cell that made the money; on ES it is the cell that loses the most.
The rule is the NQ rule. Take the sign of the 09:30–10:30 move, hold that direction from 10:30 to the close, one contract, costs charged. No-gap sessions are those whose open sits within 5% of the prior session’s range, which is the NQ study’s own threshold.
| First hour, 10:30 to close | Sessions | Rest of day agrees | p | Trades | Per session | Total | t | p |
|---|---|---|---|---|---|---|---|---|
| All sessions | 3,230 | 50.7% | 0.4083 | 3,230 | −$10.84 | −$35,010.00 | −0.45 | 0.6553 |
| Quiet opens | 1,578 | 49.7% | 0.8208 | 1,578 | −$18.16 | −$28,663.50 | −0.70 | 0.4870 |
| Loud opens | 1,652 | 51.8% | 0.1608 | 1,652 | −$3.84 | −$6,346.50 | −0.10 | 0.9242 |
| No-gap sessions | 264 | 45.5% | 0.1568 | 264 | −$140.86 | −$37,188.00 | −1.73 | 0.0855 |
| Gap sessions | 2,966 | 51.2% | 0.1923 | 2,966 | +$0.73 | +$2,178.00 | 0.03 | 0.9770 |
| Long every session, 10:30 to close | — | — | — | 3,230 | −$14.71 | −$47,497.50 | −0.60 | 0.5457 |
Read the two halves of the split against each other. On the 2,966 gap sessions the rule is an exact null at $0.73 a session. On the 264 no-gap sessions, the ones the NQ article singled out, it drops to −$140.86. The whole table also sits below zero: being long from 10:30 to the close every session pays −$14.71, and the momentum rule across all sessions pays −$10.84, so the work buys $3.87 a session and neither is a business.
The fifteen-minute version of the same question is the shorter-horizon sibling and shows nothing either. We had run it first, before we went back and checked the horizon the NQ claim was actually made at, and it is worth keeping in view because it fails the same way.
| First fifteen minutes, 09:45 to close | Sessions | Rest of day agrees | p | Trades | Per session | Total | t | p |
|---|---|---|---|---|---|---|---|---|
| All sessions | 3,221 | 49.5% | 0.6218 | 3,221 | +$0.67 | +$2,155.50 | 0.02 | 0.9801 |
| Quiet opens | 1,546 | 49.2% | 0.5586 | 1,546 | +$10.98 | +$16,980.50 | 0.36 | 0.7152 |
| Loud opens | 1,675 | 49.9% | 0.9221 | 1,675 | −$8.85 | −$14,825.00 | −0.20 | 0.8387 |
| No-gap sessions | 265 | 46.8% | 0.3257 | 265 | −$40.77 | −$10,805.00 | −0.47 | 0.6409 |
| Gap sessions | 2,956 | 49.8% | 0.8397 | 2,956 | +$4.38 | +$12,960.50 | 0.16 | 0.8763 |
| Long every session, 09:45 to close | — | — | — | 3,221 | −$0.59 | −$1,894.50 | −0.02 | 0.9826 |
The no-gap cell loses $40.77 a session on 265 sessions here, so the sign is the same at both horizons and only the size changes. No agreement cell in either table gets past 51.8%, and no cell in either table has a p-value under 0.08.
One honest limit. Only 264 to 265 ES sessions out of 3,643 qualify as no-gap under the NQ study’s 5%-of-prior-range definition. That is the smallest sample anywhere in this article, and it is small enough that a t of −1.73 is not proof of an inverse effect. The defensible statement is that the NQ result does not replicate on ES, not that it is false.
What we changed
Nothing entered the book. Two things changed in how we work.
- The thirteen-cell clock joins the list of families we will not re-test. It fails against its own shuffles by a wider margin than the calendar did, and we now have the shuffled distribution on file rather than an impression.
- The NQ gap study’s open lead is closed, in public, at 45.5% agreement on the cell it was made about. We published it as a lead, so we publish it as a null.
An open lead that never gets closed is how a research blog quietly accumulates debt, because every unresolved “worth following” reads as a half-promise that something was there. We would rather spend a section killing our own lead than leave a reader chasing it.
The archive this ran on is for sale: ES ticks back to 2014 with the real aggressor side on every print, in the historical data packages.
Methodology: ES cash-session minute bars (09:30–16:00 New York) built from our own tick archive, 2 January 2014 to 10 September 2026, 3,643 sessions. The clock cuts each session into thirteen half-hour slots; a cell’s move is its last close minus its first open on one contract, and cells are holds rather than trades, so no cost is charged within a cell. t-statistics are one-sample against zero on each cell’s session series. The multiplicity test permutes each session’s thirteen half-hour returns among themselves 500 times and records the largest |t| across the thirteen cells per run. The momentum tests run at two horizons: the first-fifteen-minutes version takes the sign of the 09:30–09:45 move and holds 09:45 to the close, the first-hour version takes the sign of the 09:30–10:30 move and holds 10:30 to the close. Both trade one contract and are costed at $4.50 commission plus two ticks of slippage per round trip, which on ES is $29.50; agreement p-values are two-sided binomial against 0.5. Quiet opens are sessions whose first-window range, fifteen minutes or the first hour to match the test, is below its own trailing 60-session median.
Frequently asked questions
Is there a best time of day to trade S&P futures?
Not for direction. Across thirteen half-hour cells on 3,643 ES sessions, the best t-statistic in the whole table is 14:30 at 1.33, p = 0.1832, and nothing else comes closer to significance. The largest average move is the opening half-hour at $10.00 on one contract, which is a hold with no cost charged against it.
Does the opening half-hour have an upward bias on ES?
It pays $10.00 on one contract with 50.1% of sessions up, at t = 1.02 and p = 0.3091. That is a coin flip with a rounding error on top, and it is measured as a hold rather than a trade, so the $29.50 round-trip cost has not been taken out of it yet.
Why does the time-of-day table look so convincing in most places it is published?
Because thirteen cells are thirteen chances and only the winner gets shown. We ran the same thirteen-cell grid on 500 shuffled versions of the same sessions: the best shuffled cell averages |t| = 1.97 and its 95th percentile is 2.83, against our real best of 1.33. 93.2% of shuffled runs produce a better-looking winner than the real clock does.
What is the intraday clock actually good for?
Sizing and execution. Average half-hour range falls from 14.91 index points at 09:30 to 8.41 at 12:30, and average volume falls from 163,950 contracts to 56,095 before returning to 165,104 into the close. A stop that is sensible at the open is loose at lunchtime, and that ratio is one of the most stable things in the archive.
Does early-session momentum predict the rest of the S&P day when there is no gap?
No, and on ES it points the other way. Our NQ gap study left open the finding that the wait-for-the-first-hour rule made +$118k at t = +2.3 on no-gap days. On 264 no-gap ES sessions the same rule loses $140.86 a session at t = −1.73, with the rest of the day agreeing with the first hour only 45.5% of the time. The shorter fifteen-minute version of the same rule loses $40.77 a session on 265 no-gap sessions.