The 80% Rule Fills 37.2% of the Time and Loses to Its Own Control
We rebuilt the prior session's volume profile from our own ES tick archive across 3,098 sessions and tested the 80% rule. Price traversed the value area on 37.2% of qualifying sessions, not 80%. Against a mirrored control it looks like a 21.2-percentage-point edge at t = 11.67. Against a control that keeps the direction and only swaps the distance, the value area's far edge is reached 5.8 percentage points less often than a nameless price. Trading it lost $17,866.75 over 1,119 trades.
Price traversed the prior session’s value area on 37.2% of the sessions that qualified for the 80% rule. That is the smaller of the two findings. The larger one is that the control almost everybody uses turns this null into a 21.2-percentage-point edge at t = 11.67, and we only caught it because we ran a second control.
This is the sharpest control demonstration in the series so far. The same test, on the same 3,098 sessions, produces a result you could sell a course with and a result that says the level does nothing. The difference between them is one design decision.
The rule
- Build the prior regular session’s volume profile from real minute volume, bucketed at one index point.
- The value area is the smallest set of price buckets holding 70% of the session’s volume. Its low is VAL, its high is VAH.
- A session qualifies if it opens outside that range, above VAH or below VAL.
- It re-enters if it trades back to the near edge — VAL when the open was below, VAH when the open was above.
- It traverses if, after re-entering, it reaches the far edge. That is the 80% rule’s claim.
- Control 1, the mirror: the same distance from the open, on the other side. This is the control everybody reaches for.
- Control 2, the borrowed distance: the same direction, the same distance distribution, but the distance is taken from a different qualifying session. Shuffled 200 times.
Only the second control isolates the value area. That distinction is the whole article.
The base rates
Of 3,098 sessions, 1,817 opened outside the prior value area, which is 58.7% of the sample. Of those, 61.6% traded back inside. That leaves 1,119 sessions where the rule is live and has an opinion.
| Sessions | Share | |
|---|---|---|
| Opened outside prior value area | 1,817 | 58.7% of all sessions |
| Traded back inside | 1,119 | 61.6% of those |
| Traversed to the far edge | — | 37.2% of those |
The median traverse asked for is 23.50 points. So the first finding is dull and complete: the number is 37.2%, not 80%.
The two controls, side by side
The chart puts four bars next to each other: the claim, what we measured, the control that counts, and the control that flatters. Read the third and fourth bars first, because the gap between them is the point.
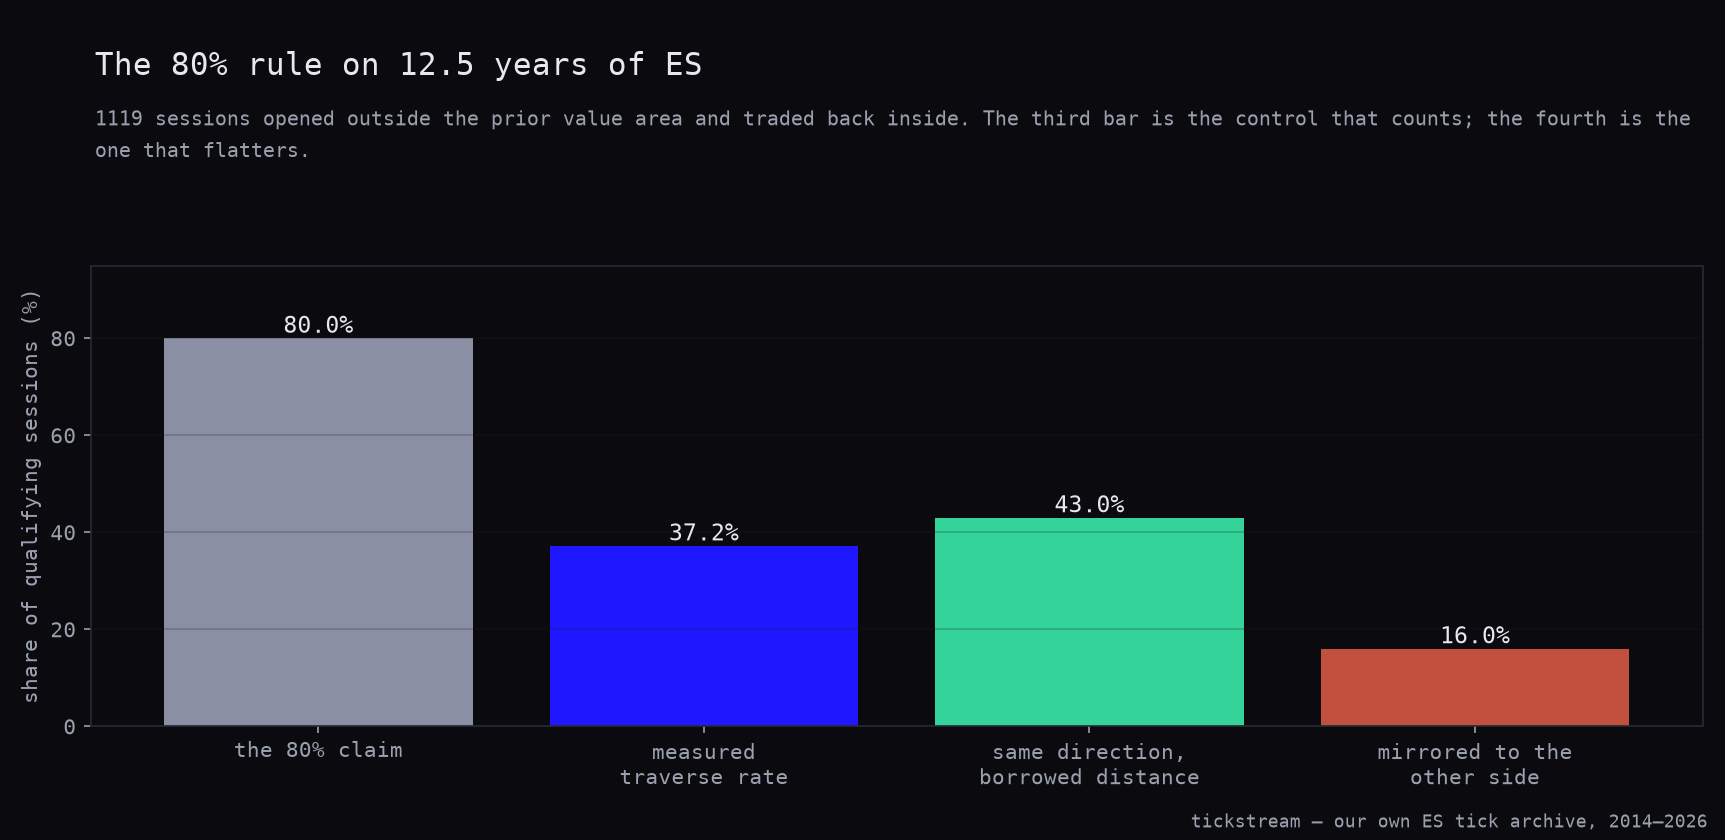
Against the mirror, the value area is superb. It traverses on 37.2% of qualifying sessions while an equally distant price on the other side of the open is reached only 16.0% of the time. The value area is ahead by 21.2 percentage points, the t-statistic is 11.67, and the p-value rounds to zero at four decimals.
| Reached | Control minus the value area’s 37.2% | |
|---|---|---|
| Mirrored to the other side | 16.0% | −21.2pp |
| Same direction, borrowed distance | 43.0% | +5.8pp |
That first row is contaminated, and the reason states in one sentence. A session that opened below value and traded back into it is already moving up, so an upward target beats an equally distant downward one for reasons that have nothing to do with the value area. The mirror is measuring the move that qualified the session, then handing the credit to the level.
The second control keeps the direction. It keeps the distance distribution too. It changes exactly one thing: the distance comes from a different qualifying session, so the target is no longer the value-area edge. Run 200 times, that nameless target is reached 43.0% of the time.
The real value area reaches 37.2%. The gap is −5.8 percentage points. The control’s 95th percentile is 44.4%, and every single one of the 200 control runs came in above the real level.
State it without hedging. The far edge of the value area is reached less often than an arbitrary price the same distance away in the same direction. It is not a magnet. If anything it is slightly harder to reach than a nameless price, which is what you would expect if the edge is simply the outer boundary of where a lot of two-sided trading already happened.
Trading it
A rate is not a P&L, so we traded the rule as written. Enter at the value-area edge on re-entry, stop back outside where the session opened, target the far edge. One contract, costs in, exit at the close if neither level is hit.
| Value-area traverse | |
|---|---|
| Trades | 1,119 |
| Win rate | 45.3% |
| Average | −$15.97 |
| Total | −$17,866.75 |
| Median | −$104.50 |
| Profit factor | 0.951 |
| Max drawdown | $45,110.62 |
| Sharpe | −0.16 |
| t | −0.59 |
| p | 0.5579 |
The exits split 436 stops, 345 timeouts and 338 targets. Best trade $5,020.50, worst −$3,838.88.
This is a small, unprofitable coin flip. It is not a disaster and it never blows up; it just grinds nothing out of 1,119 attempts at t = −0.59. That is what a level with no edge looks like when you actually trade it, and it is worth knowing the shape, because the shape is boring rather than obviously broken.
High-volume nodes
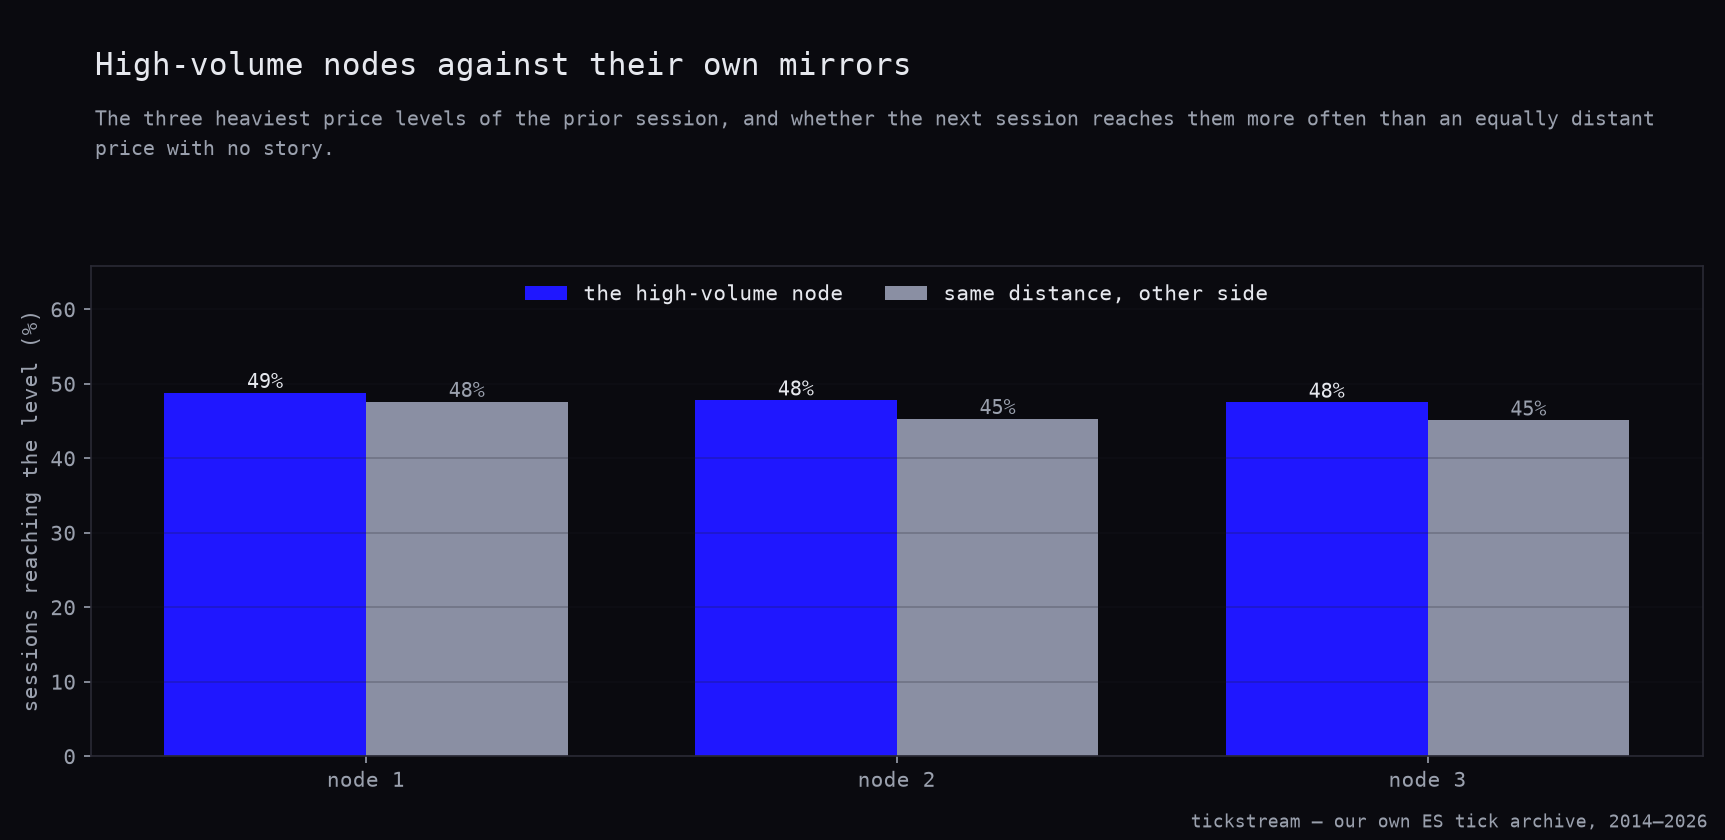
The second claim in the volume-profile family is that heavy price levels pull price back. We took the three heaviest one-point levels of each prior session and asked whether the next session reaches them more often than an equally distant price on the other side of the open.
The chart pairs each node with its mirror. The bars are close enough that the interesting question is whether the gaps clear noise, not which is taller.
| Node | Sessions | Reached | Mirror | Edge | t | p | Median distance |
|---|---|---|---|---|---|---|---|
| 1 | 2,807 | 48.8% | 47.6% | +1.2pp | 0.88 | 0.3782 | 12.75 pts |
| 2 | 2,793 | 47.8% | 45.3% | +2.5pp | 1.88 | 0.0605 | 13.50 pts |
| 3 | 2,795 | 47.5% | 45.1% | +2.4pp | 1.82 | 0.0682 | 13.50 pts |
Here the mirror is a fair control, and it matters that we say so. Nothing in this test conditions on a prior move, and the nodes sit on both sides of the open, so the direction contamination that wrecked the 80% test does not apply. These numbers are honest.
What they say is that a high-volume node is worth between one and two and a half percentage points, and none of that clears significance on roughly 2,800 observations each. The best of the three, node 2, is at p = 0.0605.
We cannot rule out a small real effect at this sample size. What we can say is that a one-point edge on a level whose median distance is 12.75 points is not something you can trade. The largest node is also the weakest of the three, which is not what a magnet story predicts.
What we changed
Nothing in the book. We were not trading the value area, and this is the third family of printed levels to fail the same way.
What we changed is narrower and more useful. We have run mirrored controls on GEX levels, on floor and Camarilla pivots, and on volume profiles, and until this test the mirror always behaved like a placebo should. Here it did not. The mirror differs from the tested level in two ways at once — the price and the direction — and the second difference manufactured a 21.2-percentage-point edge out of a null.
The rule we are writing down for ourselves: a control has to differ from the thing being tested in exactly one way. That sounds obvious written out. We had been running a two-difference control for a while without noticing, because on unconditioned tests the second difference costs nothing. It is only when the setup itself conditions on a prior move — as the 80% rule does, by requiring a re-entry — that the mirror stops being a placebo and starts being a tailwind.
Our NQ value-area test reached the same verdict on seven years of Nasdaq data. The extra five years of S&P history did not rescue the rule, and the ES pivot work showed the same mirror problem in a different family. The difference is that there we caught it in the shape of the results. Here we only caught it because a second control disagreed with the first.
Data: tickstream ES tick archive, 3,098 regular sessions, 2014-01-03 to 2026-09-09. Session 09:30–16:00 New York, management on one-minute bars. Volume profiles built from real minute volume at one-point resolution; value area is the smallest set of buckets holding 70% of session volume. Controls: mirrored across the open, and same-direction with the traverse distance borrowed from another qualifying session over 200 shuffles. Costs $29.50 a round trip on one ES contract — $4.50 commission plus two ticks at $12.50. Stops resolve before targets when a single bar contains both. Significance from Welch two-sample t-tests on the hit rates and a one-sample t-test on trade P&L.
Frequently asked questions
Does the 80% rule work on the S&P 500?
Not at anything like the advertised rate. Across 3,098 ES sessions, 1,817 opened outside the prior session's value area and 61.6% of those traded back inside. Of the 1,119 that re-entered, 37.2% went on to reach the far edge of the value area. The rule is named after a number it misses by more than forty percentage points.
Why does the value area look strong against a mirrored control?
Because the mirror changes two things at once. A session that opened below value and traded back into it is already moving up, so an upward target beats an equally distant downward one with no help from the value area. That contamination is worth 21.2 percentage points here, at t = 11.67.
What happens with a fair control?
The value area loses. Borrowing the traverse distance from a different qualifying session, in the same direction, that arbitrary target was reached 43.0% of the time against the value area's 37.2%. All 200 control runs beat the real level, and the control's 95th percentile was 44.4%.
Is the value-area traverse tradeable?
No. Entering at the value-area edge on re-entry, stopping back outside the open and targeting the far edge produced 1,119 trades, a 45.3% win rate and a loss of $17,866.75 after costs. The profit factor was 0.951 and the t-statistic −0.59.
Do high-volume nodes act as magnets?
Barely, if at all. The heaviest prior-session price level was reached on 48.8% of sessions against 47.6% for an equally distant price on the other side, an edge of 1.2 percentage points at p = 0.3782. Nodes two and three showed 2.5 and 2.4 points, neither clearing p = 0.05 on roughly 2,800 observations each.