Three Things 7 Years of Options Data Refuses to Predict (and the One Thing It Nails)
We rebuilt the implied move through the trading day from millisecond options quotes, measured morning 0DTE flow, and computed the full IV term structure back to 2019 — hunting an intraday regime signal. All three ideas died honestly: trend-vs-reversion stays unpredictable, 'unconsumed' implied move knows nothing, and the term-structure slope is the IV level in a costume. What survives is amplitude.
We just finished building something almost nobody has: the complete OPRA options tape for QQQ and SPY — every print against its standing NBBO, 7.4 years, 990 million rows — plus full daily chains with open interest back to 2019.
The dream question for any intraday trader: can this data tell you, in the morning, what kind of day it will be? Trend or chop? Expansion or drift?
We tested the three most mechanism-plausible versions. Spoiler: the graveyard grew by three.
Idea 1: Morning 0DTE flow → rest-of-day character
If dealers have to hedge 0DTE flow all day, an aggressive morning should telegraph the afternoon. We built aggressor-signed flow for the first 30 minutes — volume intensity, put/call mix, intermarket sweep rate — normalized against each measure’s own trailing 60 days, and tested it against rest-of-day (10:30–16:00) trend efficiency and range on 1,685 days.
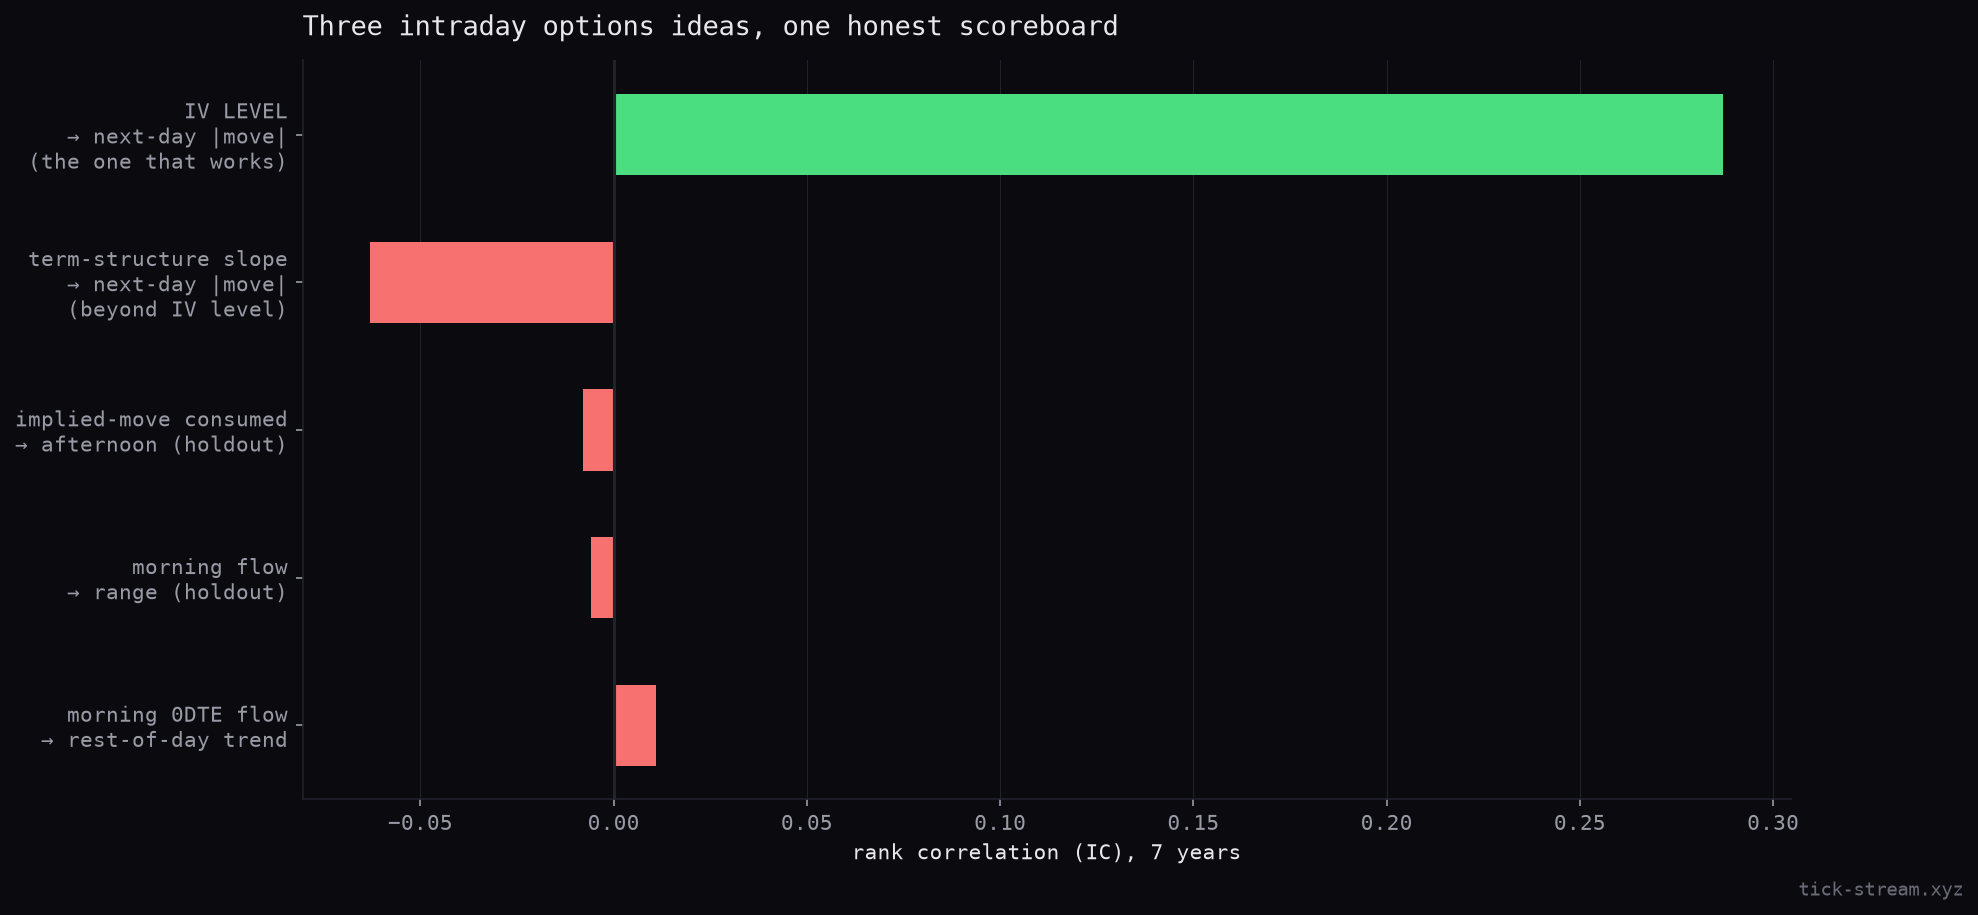
Dead. Trend-efficiency ICs sit at 0.01. The one seemingly-alive channel — morning volume → afternoon range — printed IC +0.113 in training and −0.006 in the holdout. Textbook mirage. Conditioning inside gamma regimes made it incoherent rather than sharper.
Idea 2: Implied-move consumption
The tape lets you do something genuinely new: price the ATM straddle during the day and know how much move the market still expects. Compare that to what the morning already delivered and you get a “consumption” ratio — an underspent morning should, the story goes, predict an afternoon catch-up.
Dead. Across ~1,900 days, consumption z-scores predict afternoon range and net movement with ICs of −0.01 to +0.04. If anything, overspent mornings had the marginally bigger afternoons (1.16% vs 1.29% vs 1.31% flat middle) — backwards from the thesis and comfortably inside noise. The intraday vol market reprices fast enough that nothing is left on the table.
Idea 3: The term-structure stress gate
With 35 expirations per day back to 2019, we computed the real front-vs-30-day IV slope daily. And it looks magnificent: backwardation days (front >2% over 30d) see 151-point next-day moves against 107 in contango, with a 5th-percentile tail of −$6.8k vs −$4.8k per contract. Stable out of sample (holdout IC +0.24). Ship it?
No — because we asked the checklist question that kills most vol indicators: does it know anything the plain IV level doesn’t? Rank-residualize the slope against the level and its remaining correlation with next-day movement is −0.06. The term structure is the IV level in a costume. We already gate on the level; the slope adds nothing.
What’s left standing
Two amplitude channels, boringly reliable across every test we’ve ever run on this data:
- The ATM IV level forecasts next-day movement size at rank-IC ≈ 0.3–0.4 — the single strongest forecast in our research program. It gates one of our live sleeves.
- Negative net gamma → ~40% larger ranges (seventh independent replication).
Both tell you how big the day gets. Neither — and nothing else we’ve found in 990 million prints — tells you which way, or whether it trends. Day-character remains unpredictable from options exactly as it was from price.
One direction signal did survive this dataset’s seven-signal battery. It’s a different story, with a different mechanism — and it’s live.
All series used here (chains, OI, tape) are available as an API.
Frequently asked questions
Can morning options flow tell you if the day will trend or mean-revert?
No. We built aggressor-signed 0DTE flow for the first 30 minutes (volume intensity, put/call mix, sweep rate) across 1,685 days and tested it against rest-of-day trend efficiency. Every correlation sits around 0.01, and the one that looked alive in training (volume → range, IC +0.11) collapsed to −0.006 out of sample. This matches what we found from price data alone: WHETHER a day trends is unpredictable — only how BIG it gets clusters.
What is 'implied move consumption' and does it work?
From the options tape you can price the ATM straddle at 10:30 and know exactly how much move the market still expects for the day — then compare it to what the morning already delivered. The idea: an 'underspent' morning predicts an afternoon expansion. Measured on ~1,900 days it predicts nothing — ICs near zero, and days that overspent their implied move actually had marginally LARGER afternoons than underspent ones. The market's intraday repricing is efficient enough that the residual carries no signal.
Is the IV term structure (backwardation vs contango) a useful signal?
It looks spectacular until you control for the IV level. Backwardation days see 151-point next-day moves vs 107 in contango, with much fatter tails — but the slope's correlation with next-day movement AFTER removing what the plain IV level already says is −0.06. The term structure is the IV level wearing a costume. If you already gate on IV (we do), adding the slope adds exactly nothing.
So what DOES options data predict?
Amplitude, reliably, through two channels: the ATM implied vol level forecasts next-day movement size (rank IC ≈ 0.3–0.4 — the strongest single forecast we've ever measured), and negative net gamma days run ~40% larger ranges. Both are regime/sizing inputs, not direction calls. Plus one direction signal that survived a separate seven-signal battery — that one became a live sleeve.
Why publish failed tests?
Because the graveyard is the method. Any dataset this rich will hand you dozens of in-sample patterns; the only way to know which ones are real is to kill the rest in public, with placebos and holdouts, and let the survivors carry the burden of proof. Six of seven ideas from this dataset died. The published failures are what make the one survivor credible.