Options Flow Bias: What the Score Measures, and Why It Is Not a Forecast
The flow-bias panel folds customer net, sweep imbalance, the largest prints and the institutional split into one bullish-or-bearish reading. We rebuilt it with the terminal's own formula on 1,593 sessions of QQQ option tape and lined it up with NQ: the settled reading describes the session it came from, and says nothing reliable about the next one.
The flow-bias panel takes four different reads of the option tape and folds them into one line: bullish, bearish or neutral, with a strength from 1 to 10, and every input shown beside it. It is built for the moment you glance at the screen and want to know which way the option market has been leaning today without reading ten thousand prints.
This page explains exactly how the terminal computes it, and then what happened when we rebuilt the score for every session in our option-tape archive and lined it up with NQ. The short version: the settled reading is a fair description of the day’s flow, it lines up with the day’s move in recent years, and it tells you nothing dependable about tomorrow.
What goes into the score
The terminal reads every print on the underlying’s nearest expiries (QQQ for NQ, SPY for ES) and classifies it from its exchange condition code and its price against the quote at that moment: nearer the offer is a buy, nearer the bid a sell, exactly at the midpoint stays unknown. Every sided print is then given a direction: a bought call or a sold put is bullish, a bought put or a sold call is bearish.
| Input | What it counts | Scaling | Weight |
|---|---|---|---|
| Customer net | Bullish vs bearish volume in price-improvement auction prints and small-lot (10 contracts or fewer) auto-executions | imbalance × 6 | 0.35 |
| Sweep imbalance | Bullish vs bearish volume in intermarket sweeps, one order split across exchanges | imbalance × 8 | 0.25 |
| Large prints | The 12 largest prints by premium, sweep fragments merged; prints at the midpoint count for neither side | imbalance × 2 | 0.25 |
| Institutional | Bullish vs bearish volume in crosses and single-leg floor trades | imbalance × 2 | share of session × 15, max 0.15 |
Each input is clamped to −1…+1, the weighted average is the score, and anything beyond ±0.03 gets a direction. The customer definition is the calibrated one: auction plus small-lot volume sits about 5% from the clearing house’s published customer volume. The buy/sell side on top of it is an inference from the quote, which no clearing data can confirm.
Dealer gamma is deliberately left out. It predicts how far the market moves, not which way, and it lives in its own panel, the volatility regime.
What our data says: today, not tomorrow
We ported the terminal’s formula line for line, including the rule that refuses to publish a session with too few auction prints, and ran it over our archive of QQQ option prints: 1,593 usable sessions from November 2019 to August 2026. For each session we computed the score as it stood at the close and at four points during the day, and compared it with NQ’s move from the 09:30 open to the 16:00 close.
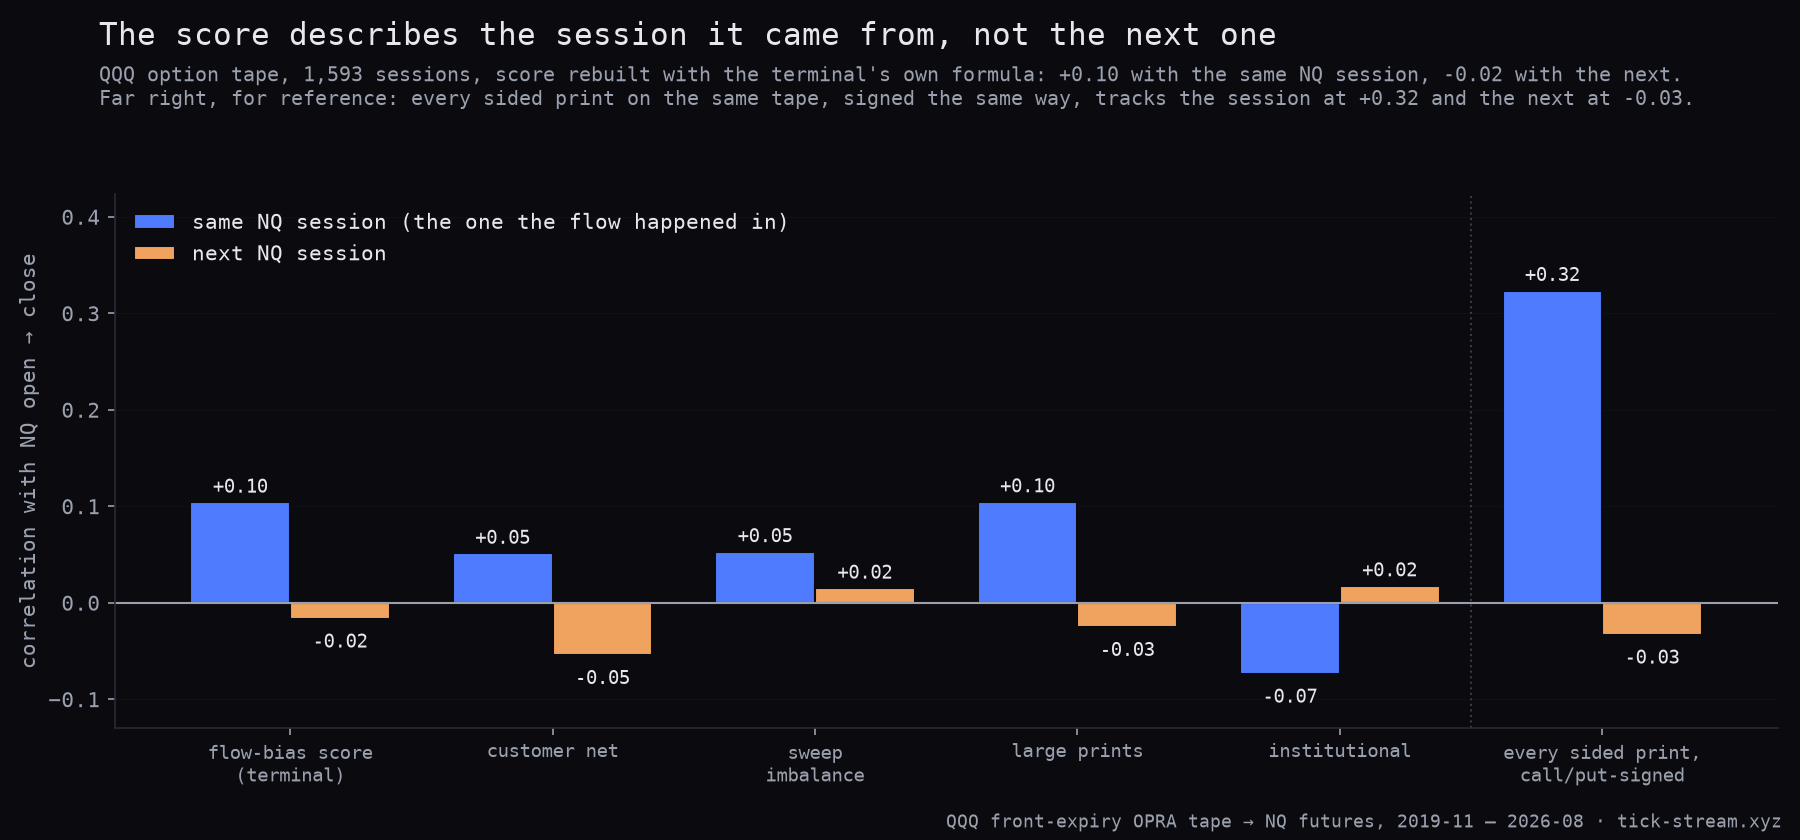
| Same NQ session | Next NQ session | |
|---|---|---|
| Score at the close, all sessions | +0.10 (t = 4.2) | −0.02 (t = −0.7) |
| 2019 – 2022 (743 sessions) | +0.02 | +0.02 |
| 2023 – 2026 (850 sessions) | +0.23 | −0.07 |
| Every sided print, signed the same way | +0.32 | −0.03 |
What the numbers say:
- The settled reading describes the day, and more so lately. At the close the score correlates +0.10 with the NQ session it was built from, and +0.23 since 2023, against +0.02 before. Of the four inputs, the large prints carry most of it (+0.10); customer and sweep flow add a little (+0.05 each), and the institutional input leans slightly the wrong way (−0.07).
- All of the tape describes it better than the score. Every sided print, signed by the same call/put rule, correlates +0.32 with the same session. The score deliberately weights a few groups of participants rather than the whole tape, and that costs it some of the description.
- Nothing carries to the next session. The score: −0.02. Every sided print: −0.03. The SPY version, compared with the same NQ sessions, gives +0.20 on the day and +0.04 on the next.
- During the session it is not a timing tool. Read at 11:00, noon or 14:00, the score correlated between −0.01 and +0.02 with the NQ move so far and between +0.02 and +0.04 with the move still to come. Traded from noon to the close in the direction of its label, it averaged $12.40 a contract per day at t = 0.19.
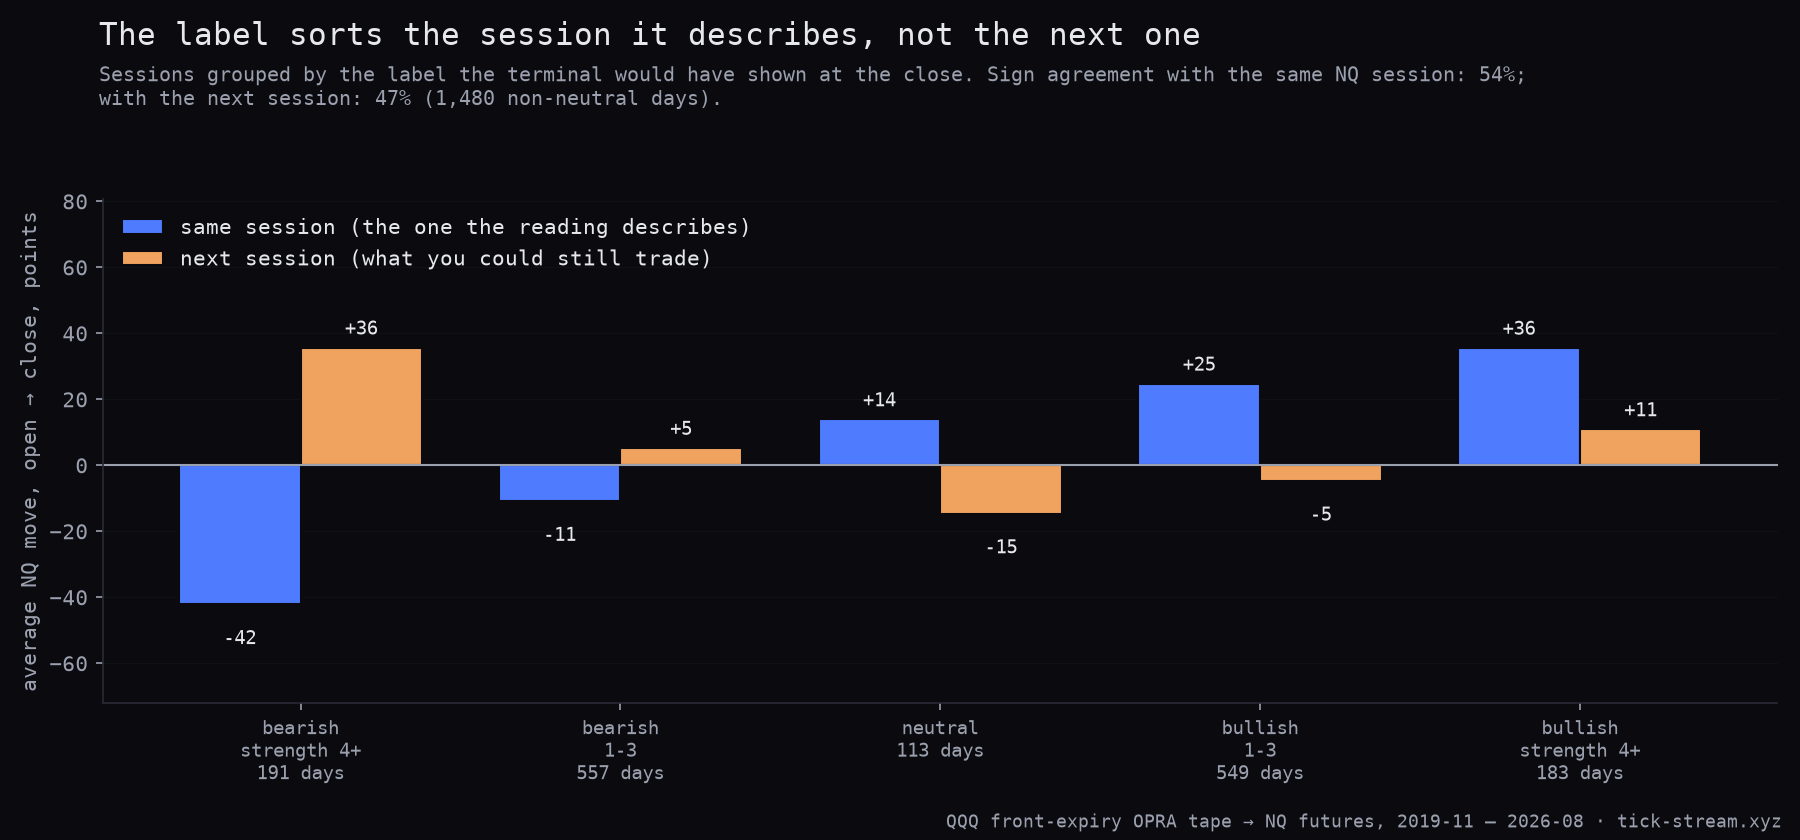
Grouped by label, the same picture. Sessions the terminal closed as bearish with strength 4 or more averaged −42 NQ points; bullish 4 or more, +36. The label agreed with the direction of the same session on 54% of non-neutral days and with the next session on 47%. The readings are balanced: 47% of sessions closed bearish, 46% bullish.
The next-session column has one tempting bar: the strongest bearish days were followed by +36 points on average. Following the closing label into the next session lost about $140 a contract per trade (t = −1.45), but that tilt came entirely from 2023 to 2026 (t = −1.84; 2019 to 2022, t = 0.08). It is not a signal, and we would not build a trade on it.
How to read it in the terminal
- Read it as a summary of today. A strong bearish reading says the option flow that matters most, the calibrated customer volume, the sweeps and the biggest tickets, leaned to puts bought and calls sold. That is useful context for how the day is being traded. It is not a forecast.
- Look at the inputs, not only the headline. The panel shows every component with its weight. When the large prints and the customer flow disagree, you are looking at a mixed day, and the headline number is an average of two opposite stories.
- Do not wait for it to confirm an entry. Read intraday, it did not track the NQ move so far, let alone the next hour. The flow indicators pane, net option delta per minute, is the minute-by-minute view of the same flow.
- For tomorrow, look at extremes, and read them the other way round. The options signal that survived our testing is contrarian: put/call volume far above its 60-day norm preceded NQ strength the next session and call-heavy extremes preceded weakness, both sides, at t-statistics of about 3.1 to 3.7. We wrote that up in Counterflow.
Limits worth knowing
- The archive holds the front expiry only. The live terminal reads the two nearest expiries, so the live score can differ from our rebuild on any given day.
- Buy and sell are inferred. Side comes from the print against the quote. Prints at the exact midpoint are left out, and the clearing house publishes volume by account type, not by side, so the direction part cannot be independently checked.
- Early sessions are excluded. Sessions without enough auction prints fail the terminal’s own publishing rule, which removed most of 2019; 91% of the archive’s QQQ sessions were usable.
- One index, one mapping. We tested QQQ flow against NQ futures, the pair the terminal uses. Single-stock option flow may behave differently, and we have not tested it.
For the broader question of which option-data readings forecast anything intraday, see what options data cannot predict intraday.
Methodology: tickstream OPRA archive, QQQ front-expiry trades with the quote at each print, 4 November 2019 to 7 August 2026, 1,593 sessions that pass the terminal’s publishing rule (at least 200 prints and 10% auction prints) and have complete NQ minute data. Score rebuilt with the terminal’s formula: auction prints (conditions 125/126) plus unclassified prints of 10 contracts or fewer as customer, condition 95 as sweep, crosses and single-leg floor trades as institutional, midpoint quote rule, direction = bought call or sold put vs bought put or sold call, sweep fragments merged per contract and second, top 12 prints by premium with midpoint prints skipped, weights and scalings as in the table. NQ continuous front month from our minute store, 09:30 open to 16:00 close in New York time; intraday checkpoints use the NQ price at the checkpoint minute. Pearson correlations; t-statistics from the correlation and sample size, or from the per-trade mean for the label trades ($20 per NQ point, no costs). Every sided print: call buys minus call sells minus put buys plus put sells over total sided volume, prints at or through the offer as buys and at or through the bid as sells, same tape and sessions.
Frequently asked questions
Does options flow predict where the market goes next?
Not in our data. On 1,593 sessions of QQQ option tape, the terminal's flow-bias score at the close correlated +0.10 with the NQ session it came from and −0.02 with the next one. Every sided print on the same tape, signed by call and put, correlated +0.32 with the same session and −0.03 with the next. Option flow describes the move that is happening; it does not forecast the next.
How is the flow bias calculated?
It is a weighted average of four inputs, each squeezed into −1 to +1: the customer imbalance from auction and small-lot prints (weight 0.35), the intermarket-sweep imbalance (0.25), the premium-weighted direction of the twelve largest prints of the session (0.25), and the institutional cross and floor imbalance, whose weight scales with its share of the session and never exceeds 0.15. Every input counts a bought call or a sold put as bullish and a bought put or a sold call as bearish. Above +0.03 reads bullish, below −0.03 bearish, with a strength from 1 to 10.
Should I fade a strong bearish options flow reading?
Not on this evidence. Following the closing label into the next session lost about $140 a contract per trade at t = −1.45, which hints at a contrarian tilt, but the tilt lives entirely in 2023 to 2026 and is not significant even there (t = −1.84). The options signal that did survive our testing as a contrarian is a different one: put/call volume extremes against their own 60-day norm.
Why is dealer gamma not part of the flow bias?
Because gamma is a magnitude signal. In our seven-year study negative dealer gamma preceded about twice the next-day move, but the share of up days was almost the same in both regimes. Mixing it into a directional score would add a number that does not know the direction. The terminal shows it separately as the volatility regime.
What options signal does work on the next day?
The one that held up in our testing reads positioning extremes the other way round: put/call volume far above its own 60-day norm has preceded NQ strength the next session, and call-heavy extremes weakness, at t-statistics of about 3.1 to 3.7 depending on the variant, on both sides. That is a contrarian read of an extreme, not a following read of today's flow.