We Backtested Every Setup From Two Best-Selling Volume Profile & Order Flow Books on 7 Years of NQ
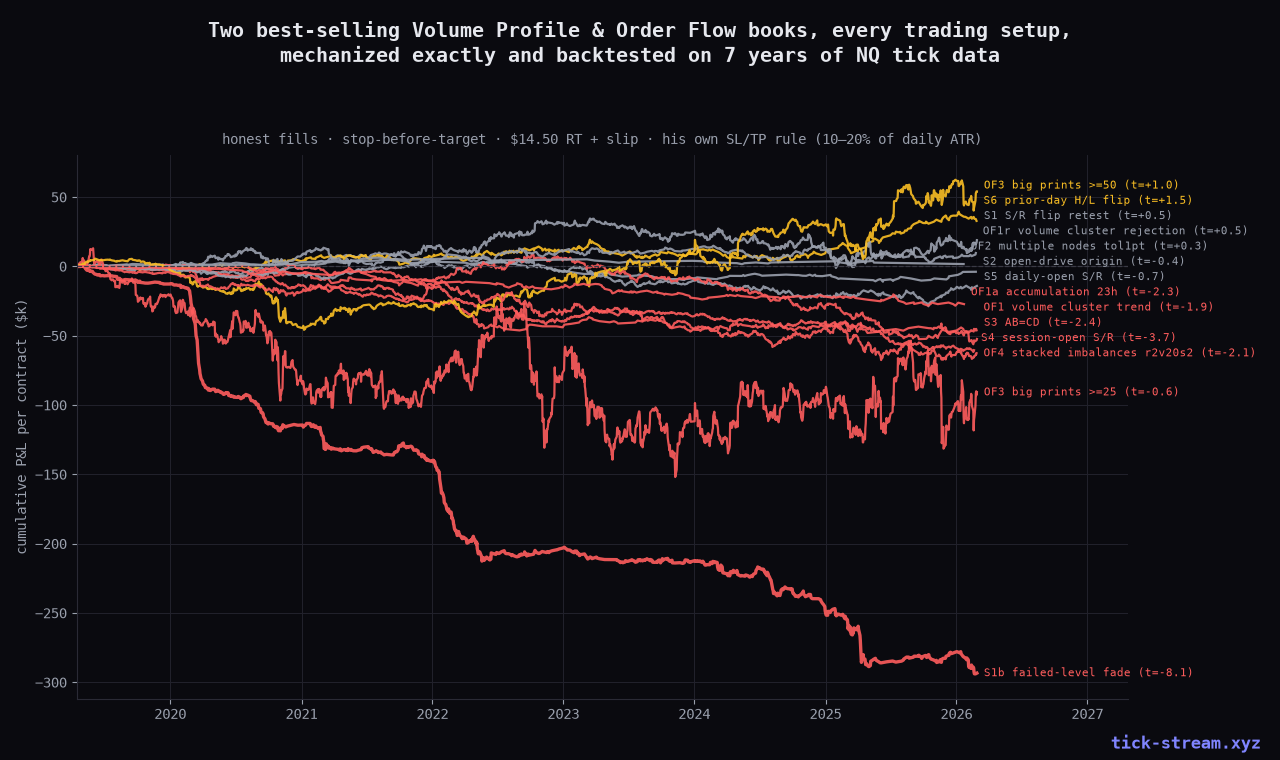
Two popular trading books teach 13 concrete setups: S/R flips, open-drives, AB=CD, volume clusters, multiple nodes, stacked imbalances, unfinished business. Rare for trading books, they're specific enough to test. We mechanized every single one on 7 years of NQ tick data with honest fills, the authors' own risk rule, and placebo controls. Result: not one setup survives — and the one that looks positive is beaten by a two-day-old stale level.
Most trading books are safe from backtesting. The rules are vibes — “look for confluence”, “trade with context” — and any losing trade can be blamed on missing context. Two of the best-selling books in the volume-profile world are a genuine exception: one on Volume Profile, one on Order Flow, together they teach 13 concrete setups with numbered steps. Find the heavy-volume price, wait for price to leave, enter on the first retest, stop and target at 10–20% of the daily ATR. That’s a spec. Specs can be tested.
So we tested all of them. Every setup from both books, mechanized exactly as written, on 7 years of NQ tick data — real trades, not quote volume — with our standard discipline: trade-through fills, stop checked before target, target only from the bar after entry, $14.50 round-trip plus slippage, and the books’ own risk rule (SL = PT = 10–20% of daily ATR(200), we ran all three grid points). One stat judges everything: t — how far the average daily P&L sits from zero relative to its own noise; |t| > 2 is real, less is luck.
And because a level claim is meaningless without a comparison, every family gets a placebo: a random price from the same bar, a mirrored offset level, or a stale level from two days ago.
The price-action six
The Volume Profile book opens with six price-action strategies that don’t need volume data at all. Across 3 bracket sizes each:
| Setup | Trades | Best case | Verdict |
|---|---|---|---|
| S/R flip retest | 1,897 | +$19k, t=+0.5 | noise |
| Open-drive origin retest | 177 | −$0.2k, t=−0.0 | noise |
| AB=CD | 939 | −$36k, t=−2.4 | reliable loser |
| Session-open S/R | 1,056 | −$27k, t=−0.9 (worst −$60k, t=−3.7) | loser |
| Daily-open S/R | 682 | −$9k, t=−0.7 | loser |
| Prior-day H/L flip | 514 | +$33k, t=+1.5 | see below |
Two of these deserve their own paragraphs.
AB=CD is a reliable loser. The harmonic completion trade — C retraces 50–99% of AB, project D = C + (B−A), fade at D — produced 939 trades and lost at every bracket size, t as bad as −2.4. This matches what we found inside ICT’s OTE: the Fibonacci/harmonic geometry adds nothing; any pullback works as well as the “correct” one.
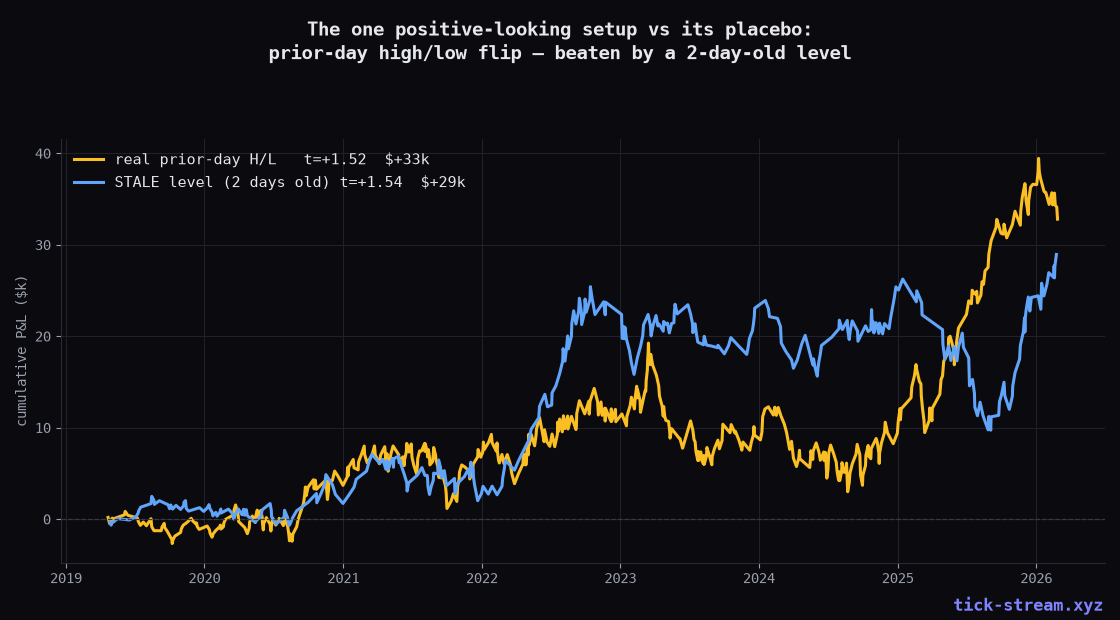
The one positive-looking line is a placebo artifact. Prior-day high/low flips (breach + 30-minute acceptance, retest entry) print t=+1.5 at the widest bracket — the only setup in either book with a pulse. So we ran the control that kills or confirms level claims: the identical rule on a two-day-old level that the book’s logic says should be stale. The stale level scores t=+1.5 too — slightly better, actually. Whatever that line is riding (mostly 2025 breakout drift), it is not information in yesterday’s high.
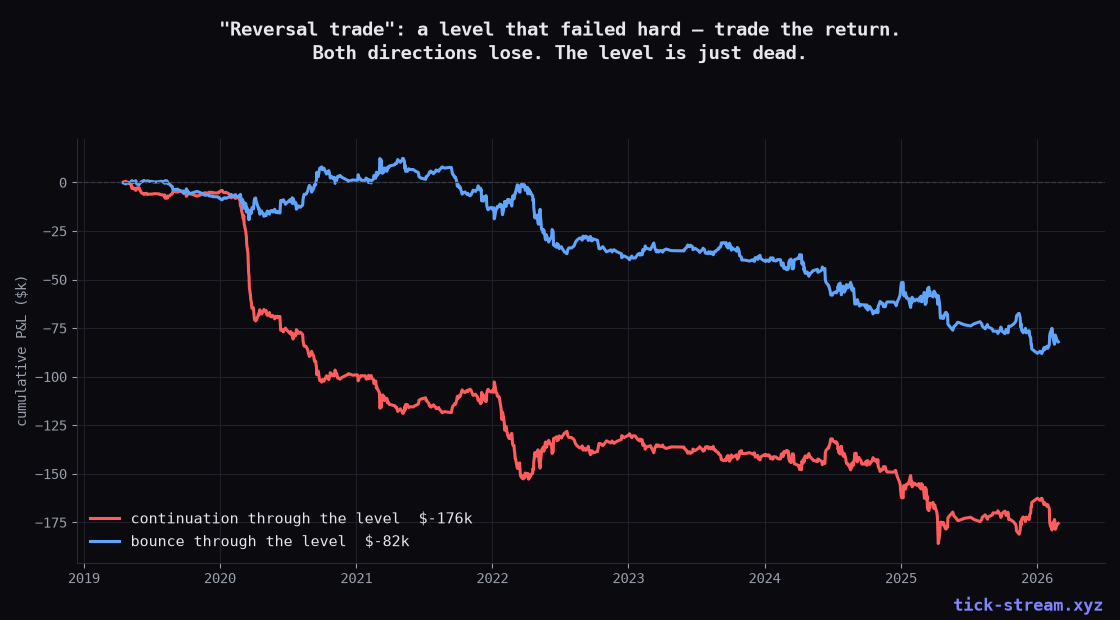
The “reversal trade” is the cleanest kill in the book. Both books teach that a level that failed — got shot through without reaction — flips its meaning: on the return, trade through it. Mechanized: 3,317 hard-breach retests. Continuation through the dead level: −$293,000 per contract, t = −8. Fine, so fade it instead? The bounce at the same levels also loses (−$79k, t=−2.5). A hard-breached level isn’t secretly bullish or bearish. It’s just dead — both entry geometries at it are adversely selected, and costs finish the job.
The order-flow five
For the Order Flow book we rebuilt what the software shows: 30-minute footprints from seven years of real NQ trades — 11.4 million price-level cells, each with total volume, aggressor-buy/sell split, and single-print sizes. Every setup follows the book’s steps: level forms, price leaves it by one or two whole footprints, enter on the first retest only.
The placebo here is the cruelest one we know: the identical trade with a random price from the same bar instead of the heavy-volume price. If footprint reading works, the real level must beat the random one.
| Setup | Trades | Result | Random-price placebo |
|---|---|---|---|
| Volume cluster in a trend | 1,225 | −$46k, t=−1.9 | −$44k, t=−1.7 |
| Volume cluster in a rejection | 833 | +$10k, t=+0.5 | −$17k, t=−0.8 |
| Accumulation first-touch | 227 | −$27k, t=−2.3 | — |
| Multiple nodes | 66* | +$2k, t=+0.3 | −$1k, t=−0.3 |
| Trades filter (prints ≥25 lots) | 14,419 | −$91k, t=−0.6 | −$193k, t=−1.2 |
| Trades filter (prints ≥50 lots) | 2,657 | +$54k, t=+1.0 | −$27k, t=−0.5 |
| Stacked imbalances | 1,675* | −$63k, t=−2.1 | ~0 |
Three findings stand out.
Two setups barely exist on NQ. “Multiple Nodes” wants two consecutive 30-minute footprints with their heaviest-volume price at the same level. On NQ the median distance between consecutive HVNs is 18 points — the same-price condition occurs on 1.8% of bars, 28 trades in seven years. Stacked imbalances (three consecutive 300% diagonal imbalances) fired five times in seven years at book spec. These setups were built on EUR futures, where a coarse effective grid makes price collisions routine; NQ’s fine grid dissolves them. The starred rows are relaxed adaptations (1-point tolerance; softer imbalance thresholds) we ran so the verdict wouldn’t rest on n=5 — and the adapted versions lose reliably (imbalances t=−2.1) or stay flat.
The 5-minute footprint doesn’t rescue them. Because “30 minutes washes out the footprint” is the obvious objection, we rebuilt the store a second time on 5-minute footprints (13.1M cells) — the book’s other chart timeframe. There the setups do exist: same-price multiple nodes fire 629 times, book-spec stacked imbalances 822 times. They still don’t work — nodes lose at every bracket (t as bad as −1.4), imbalances are flat noise (|t| ≤ 0.6).
The footprint doesn’t beat a random price. Volume clusters in trends lose almost exactly as much as their random-price placebo — the loss is the retest-in-trend geometry, and the heavy-volume decoration changes nothing. The rejection variant is positive but at t=+0.5, i.e. noise.
Big prints are the only line with a pulse — and it’s sub-significance. Levels marked by single ≥50-lot prints earn +$54k against a negative placebo, but at t=1.0 with a −$42k year (2020) inside. Statistically that’s a coin that came up nice; it would need to triple its t-stat before it’s evidence. (Its ≥25-lot sibling, with 5× the trades, loses.)
The unfinished business “magnet”
The book’s fifth concept isn’t a standalone entry: Unfinished Business — a swing high/low where the auction “didn’t finish properly” (both bid and ask traded at the extreme) — is said to work “like a magnet”: price gets drawn back to test it. It’s used to stretch take-profits, veto stop placements, and warn against entries.
A magnet claim is a probability claim, so we measured it. 1,966 30-minute swing extremes, split into failed auctions (UB) and properly finished ones (control):
- Same day: UB extremes get revisited 23.5% of the time — finished ones 25.6%. The “magnet” revisits less (z=−0.8).
- By end of next day: 66.6% vs 60.8% (z=+1.9) — a sub-significant 6-point difference, and even that carries a mechanical confound: a failed auction means the market was still actively trading both sides at the extreme, i.e. the level sits closer to where business already is.
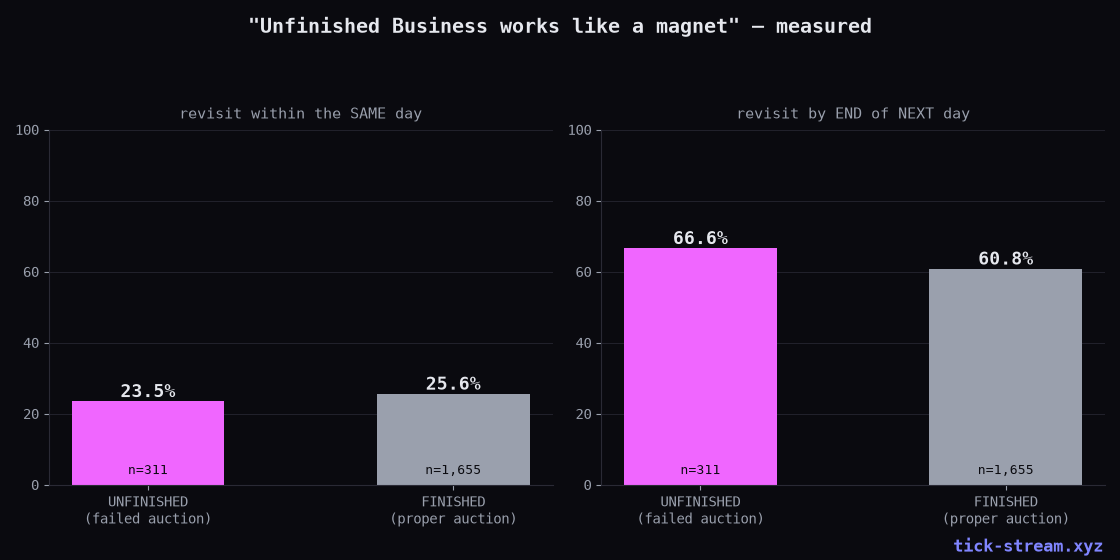
There is no pull. This replicates our footprint exhaustion test, where the same family of “the imperfection gets repaired” claims measured backwards on 7 years of ticks.
The pattern, sixth time now
We keep running level families through the same honest machine, and they keep resolving the same way: HVN reactions are base-rate, value-area rules fail, composite-profile levels lose to placebos, wickless levels invert, “draw on liquidity” levels repel instead of attract — and now the complete published curriculum of the volume-profile/order-flow school. The consistent finding across all of them: whatever mechanical edge exists on NQ lives away from levels, not at them — pullback continuation in trends, mean reversion after stretched moves, breakouts from genuine compression. At the marked level itself, the market has already absorbed the information the level carried.
To be fair to the books: the descriptive layer is real. Institutions do transact in size at specific prices; footprints do show it; the mechanics of auctions are described accurately and well. What doesn’t survive is the jump from “heavy volume traded here” to “price will react here in a tradable way”. That jump is where the placebo tests live, and no setup in either book passes one.
Methodology: NQ front-month, 2019–2026, tick store with real trades (aggressor side inferred by quote rule against the prevailing BBO). 30-minute footprints rebuilt from ~10M price-level cells. Entries as specified per setup, first test only. Fills: trade-through only, stop-before-target, target from the bar after entry. Costs $14.50 RT + 1 tick slippage. Daily-aggregated t-stats. All numbers per single contract. This is research, not trading advice; our own live, disclosed track records — including the losing ones — are on /algos.
Frequently asked questions
Do Volume Profile trading strategies actually work?
Not in our testing. We mechanized all six price-action strategies from a best-selling Volume Profile book (S/R flip retests, open-drive origins, AB=CD, session-open and daily-open levels, prior-day high/low flips) on 7 years of NQ futures tick data, using the book's own stop/target rule (10–20% of daily ATR). Every configuration either loses money or is statistically indistinguishable from zero. The best-looking one — prior-day high/low flips at t=+1.5 — was matched by a placebo using a stale two-day-old level, meaning the level itself adds nothing.
Do order flow footprint setups like volume clusters and stacked imbalances have an edge?
We built 30-minute footprints from seven years of real NQ trades (about 10 million price-level cells) and tested volume clusters in trends and rejections, multiple nodes, big-print levels (trades filter), and stacked imbalances exactly as taught — retest entries, first touch only, the book's own risk rule. None produced a positive expectancy after realistic costs, and none beat a volume-blind placebo that picks a random price from the same bar instead of the heavy-volume price. The footprint decoration doesn't add information that survives costs.
Is Unfinished Business really a price magnet?
The revisit rates don't support the magnet story. Comparing swing extremes with a failed auction (both bid and ask traded at the extreme) against properly finished auctions, revisit probabilities are close — and what difference exists is explained by the fact that failed-auction extremes sit at prices the market was still actively trading. There is no tradable pull, which matches our earlier footprint-exhaustion test where the 'unfinished level gets revisited' claim measured backwards.
What about the 'reversal trade' at a level that failed?
It's the clearest negative result in the battery. Trading continuation through a hard-breached 'dead' level lost $293k per contract over 7 years (t=−8) — and trading the bounce at the same levels also lost. When a level has been shot through without reaction, neither direction at the retest carries an edge: the market has simply absorbed it. This is the sixth time a level family has inverted or nulled under a placebo in our published research.
Why do these setups look so good on the books' example charts?
Selection. Every example chart in both books shows a level that held; the levels that broke aren't shown. Our battery counts all of them: thousands of first-touch retests, entered mechanically. At that point win rates collapse toward the base rate and expectancy goes negative after costs. That's not an accusation of bad faith — it's what discretionary example-picking always does. It's why 'compared to what?' (a placebo level, a random price, a stale level) is the only question that separates a real level from a story.