The Dealer-Gamma Gate Helps One ES Setup of Three, After the Setup It Helped Most Turned Out Not to Exist
We gated three ES setups on the previous session's SPY dealer gamma, 2019–2026. The daily RSI-2 dip goes from +$554.07 a trade to +$716.16 under the gate, and 6.4% of 500 random gates keeping the same number of trades beat it. The other two get worse: the 5-minute trend pullback by $0.92 a trade and fade-the-open by $31.43. An earlier version of this article reported the pullback improving from +$39.73 to +$54.15 with no random gate matching it; that setup was a fill-selection bug in our own engine and now loses $23.55 a trade unfiltered, which removes the stronger of the gate's two supporting cases.
We took the one options quantity that survived this series — dealer gamma, which forecasts the size of the next session and nothing about its direction — and used it to gate three ES setups. It helps one of the three. The daily RSI-2 dip goes from +$554.07 a trade to +$716.16 when entries are restricted to sessions that opened with negative dealer gamma, and 6.4% of 500 random gates keeping the same number of trades beat that.
The other two get worse.
An earlier version of this article reported two of three, and the second case was the stronger one: a 5-minute trend pullback going from +$39.73 a trade to +$54.15 with not one of 500 random gates reaching it. That setup no longer exists. It was produced by a fill-selection bug in our own engine, and corrected it loses $23.55 a trade before any gate is applied. Losing it takes the gate from a pattern to a single observation, and we would rather say so than keep a number that was never real.
The lookahead we caught, which still matters
The chain snapshot we record is the fullest one of the session. That means the dealer gamma figure attached to a given date is an end-of-session reading, built from a chain that already knows how the session went.
The first version of this test used that figure to gate trades taken during the same session. Textbook lookahead, and the tell was unmistakable: fade-the-open, a rule that loses money unfiltered and that we included precisely because it loses money, turned into a large per-trade winner. A filter that rescues a broken rule is not a filter. It is a leak.
The published version reads the previous session’s close-of-day gamma, the last figure genuinely available before the open. Under that gate fade-the-open goes straight back to losing, at −$117.80 a trade. Every number below comes from the shifted version.
That control did its job. It is worth noting that it did not catch the other defect in this article, because the other defect was not in the gate at all — it was in the machinery the gated setup ran on.
The rule
- Three ES setups, each run three ways: every signal, gated to negative gamma, gated to positive gamma.
- The gate reads SPY dealer gamma summed across the recorded chain, taken at the close of the previous session. Below zero is negative, above is positive. No band, no threshold.
- RSI-2 dip (daily): RSI-2 below 10 on the close, long, out at the next close.
- Trend pullback (5-min): EMA-50 against EMA-200 sets direction. A bar closing with the trend marks its low (longs) or high (shorts); a limit rests there for up to 24 bars. Stop one ATR(14), target two ATR, out after 48 bars. One position at a time.
- Fade the open (daily): short the open-to-close move, every session. Included on purpose as a rule we already know loses.
Costs are $4.50 commission plus two ticks of slippage, so $29.50 comes off every trade below.
The nine cells
| Setup | Cut | Trades | Win % | Avg $ | Total $ | PF | t |
|---|---|---|---|---|---|---|---|
| RSI-2 dip (daily) | every signal | 210 | 53.8 | +554.07 | +116,355.00 | 1.757 | 2.47 |
| negative gamma | 170 | 55.9 | +716.16 | +121,747.50 | 1.938 | 2.65 | |
| positive gamma | 40 | 45.0 | −134.81 | −5,392.50 | 0.773 | −0.58 | |
| Trend pullback (5-min) | every signal | 41,976 | 35.4 | −23.55 | −988,681.29 | 0.828 | −14.64 |
| negative gamma | 20,659 | 35.1 | −24.47 | −505,521.75 | 0.855 | −8.69 | |
| positive gamma | 21,317 | 35.7 | −22.67 | −483,159.54 | 0.787 | −14.09 | |
| Fade the open (daily) | every signal | 1,848 | 43.6 | −86.37 | −159,616.00 | 0.880 | −1.90 |
| negative gamma | 891 | 42.5 | −117.80 | −104,959.50 | 0.875 | −1.44 | |
| positive gamma | 957 | 44.5 | −57.11 | −54,656.50 | 0.888 | −1.32 |
The RSI-2 improvement is worth +$162.09 a trade for 19.0% of trades discarded. The trend pullback moves −$0.92 the wrong way, discarding 50.8%. Fade-the-open moves −$31.43 the wrong way, discarding 51.8%.
The control that decides it
Discarding trades changes a result whether or not the discarding rule means anything. So each gamma gate is measured against a random gate keeping the same number of trades, drawn 500 times from the unfiltered set.
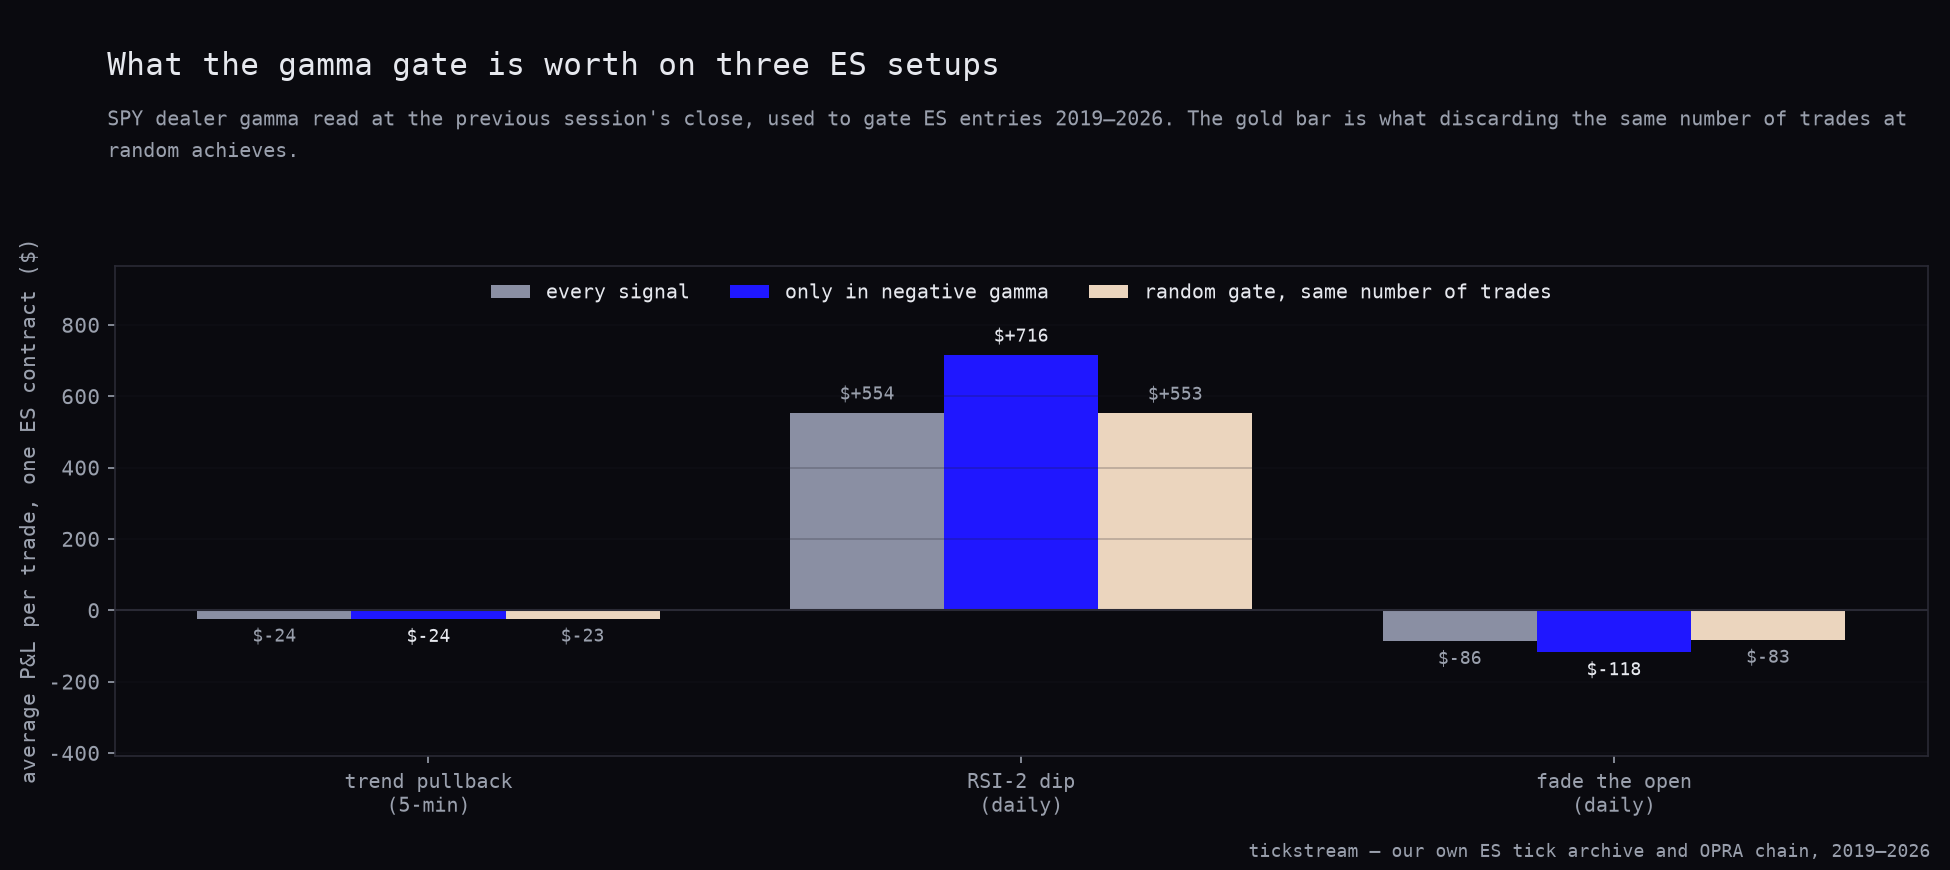
Three groups of three bars. Only in the middle group does the blue bar stand above both the grey and the gold. In the other two it sits below them.
| Setup | Gamma gate $/trade | Random gate mean $ | Random gate 95th pct $ | Random gates beating it |
|---|---|---|---|---|
| RSI-2 dip (daily) | +716.16 | +553.14 | +730.40 | 6.4% |
| Trend pullback (5-min) | −24.47 | −23.49 | −20.71 | 69.8% |
| Fade the open (daily) | −117.80 | −82.94 | −6.27 | 77.8% |
The RSI-2 row is the finding, and it is thin: the random distribution’s 95th percentile is +$730.40 against the gate’s +$716.16, so the gate does not even clear the random 95th percentile. What it clears is the count — 6.4% of random gates beat it, which is a rejection at the 10% level and not the 5%.
The other two rows are the gate failing, and one of them is still informative. 77.8% of random gates beat the gamma gate on fade-the-open: the gate takes a losing setup and makes it lose faster. A filter that improved everything it touched would be reading the market’s drift rather than its regime. This one does not, which is the behaviour of something conditional. That argument survives the correction intact — it just no longer has a second winner standing next to it.
One of three, and what that is worth
We wrote the previous version of this article around the phrase “two of three is the honest headline, not three of three.” One of three needs a different sentence.
One supporting case is a candidate, not a finding. The gate improved a 210-trade daily setup, at a margin that 6.4% of random gates matched. That is worth carrying forward and it is not worth building on. The pattern we thought we had — a regime filter that helps two different kinds of mean-reverting setup and hurts a losing one — required the two to be different setups. Now there is one.
The window is 2019 to 2026. Seven and a half years, because that is where our SPY chain store begins. We have twelve and a half years of ES ticks and this test cannot see the first five.
The RSI-2 sample is small. 210 trades unfiltered, 170 in the negative-gamma bucket, 40 in the positive one. Forty observations at t = −0.58 should be read as no evidence the setup works there, not as the setup loses there. Those are different statements and only the first is supported. The full-archive version of RSI-2 on ES is the one strategy in this entire series we could not break.
The mechanism we believed, and what is left of it
We argued that a pullback setup with a stop at one ATR and a target at two is worth more when the ATR is going to be bigger, and that the gate was telling the setup when the same geometry pays out in larger dollars. That argument was carried mostly by the trend pullback, and the trend pullback is gone.
What survives is narrower. RSI-2 buys a two-day oversold close and exits the next close — a fixed-horizon trade with no bracket at all, so the ATR-geometry story does not even apply to it. Whatever the gate is doing for RSI-2, it is not making a fixed bracket pay more. The most likely reading is that negative-gamma sessions mean-revert harder, which is a different claim from the one we made, and one this test does not isolate.
We are leaving it as an open question rather than replacing one unmeasured mechanism with another.
Why this one and not order flow
Order flow claims to know direction. Our Nasdaq work found it coincident — it explains the move that is happening, not the next one — and as a filter it made 22 of 25 otherwise-profitable combinations worse. Dealer gamma makes no directional claim at all; it measures how much the market is going to move, and our earlier ES work put a number on that and nothing else.
That distinction is still the reason we tested this. It is not, on this evidence, a reason to trade it.
What we changed
Nothing went live, and the edge file now carries the 1-of-3 count with the 6.4% control share and the window limitation attached. The entry that described this gate as improving two of three setups has been marked as half void, because half its evidence was.
The ES ticks and the SPY option chains this ran on are ours and they are for sale, in the historical data packages.
Methodology: SPY dealer gamma from our own OPRA chain recording, summed across the chain from recorded open interest and the exchange’s gamma, dealers long calls and short puts. The gate reads the figure at the close of the PREVIOUS session, the last one genuinely available before the open. The chain store starts in 2019, so the window is 3 January 2019 to 29 May 2026. Open interest is a daily OCC figure, so it describes the state at the start of a session and not intraday. Sessions after 29 May 2026 are excluded because the recorder’s last snapshot of the day is sometimes a truncated post-close chain. ES bars are built from our own tick archive; the 5-minute setup runs on regular-session bars and the two daily setups on 09:30–16:00 New York sessions. The 5-minute setup’s resting limits are resolved chronologically across all live levels, first touch takes the book — the superseded figures quoted in this article come from the same script before that engine replaced a per-level forward scan. Costs are $4.50 commission plus two ticks of slippage per round trip, $29.50 on one ES contract, deducted from every trade. A bar that contains both the stop and the target is resolved as the stop. The random gate draws each trade independently with probability equal to the negative-gamma share, 500 runs per setup, fixed seed.
Frequently asked questions
Does gating a futures setup on dealer gamma improve it?
On one of our three ES setups. The daily RSI-2 dip improves by $162.09 a trade when restricted to sessions that opened with negative dealer gamma. The 5-minute trend pullback gets $0.92 a trade worse and fade-the-open gets $31.43 worse under the identical gate. One of three is the honest headline.
This article originally said two of three. What changed?
The trend pullback was the stronger of the two supporting cases at +$39.73 a trade unfiltered and +$54.15 gated. That setup came from a fill-selection bug in our own backtest engine; corrected, it loses $23.55 a trade and the gate makes it slightly worse rather than better.
How do you know the RSI-2 improvement is not just from taking fewer trades?
Because we ran a random gate keeping exactly the same number of trades, 500 times. It averages +$553.14 a trade with a 95th percentile of +$730.40, and 6.4% of those runs beat the gamma gate's +$716.16. That is on the right side of the line but not comfortably.
What was the lookahead you found in the first version of this test?
Our chain snapshot is the fullest one of the session, so the gamma figure on a given date is an end-of-session reading. Using it to gate trades taken during that same session let the filter know where the session went, and it turned fade-the-open — a rule that loses $86.37 a trade unfiltered — into a large winner. The published version reads the previous session's close, and fade-the-open returns to losing at $117.80 a trade in negative gamma.
Is the RSI-2 result strong enough to trade?
Not on its own. The unfiltered sample is 210 trades and the positive-gamma bucket holds 40 of them. Forty observations at t = -0.58 is no evidence the setup works in positive gamma, which is not the same as evidence it loses there. The negative-gamma cell at t = 2.65 is the part that carries weight, and it is one supporting case rather than a pattern.