The '10 a.m. Key Open' Strategy: We Tested Every Claim in the Video on 7 Years of Tick Data
A popular ICT-style educator teaches 'key opens' — the 10 a.m. and midnight open prices — combined with Fibonacci OTE entries: manipulation, displacement, limit at the open, 10–15 point stop, 1:4 to 1:6 targets. We mechanized it on 7 years of NQ tick data and measured every checkable claim in the video. The level is a placebo, the fib filter costs money, the midnight-open 'magnet' rule is backwards — and the one claim that's true is true of any candle ever printed.
You may remember this educator: he’s the one whose rejection blocks we dissected — where the +$85k “edge” turned out to be a same-bar fill artifact that was honestly a $65k loser. He calls key opens “probably the second most used concept that I teach… rejection blocks being number one.” So when the key-opens video landed, it went straight into the queue.
The concept, faithfully condensed: the 10:00 a.m. ET open — the open of the 4-hour candle he trades from — is a key open. Price “manipulates” one side of it, then displaces aggressively through it; you place a limit order back at the open price, ideally where it coincides with the 0.62–0.79 Fibonacci band of the manipulation-to-displacement leg (“the 0.79… the most premium level on the fib”), stop 10–15 points, targets from the first internal low up to 1:4 and 1:6. The midnight open works the same way, with a bonus rule: if the overnight session shows little or no manipulation below it, the level becomes a magnet the day will return to. Sprinkled through the video are three measurable claims: 97% of 4-hour candles wick both sides, price manipulates around the midnight open “95% of the time,” and “we top and bottom tick very often at these levels.”
Every one of those sentences is checkable. So we checked all of them: 1,845 sessions of NQ tick data, 2019–2026, limit fills that only book when a print actually traded at the level, stop checked before target on the print sequence, $14.50-class round-trip friction.
The strategy: statistically nothing, in every configuration
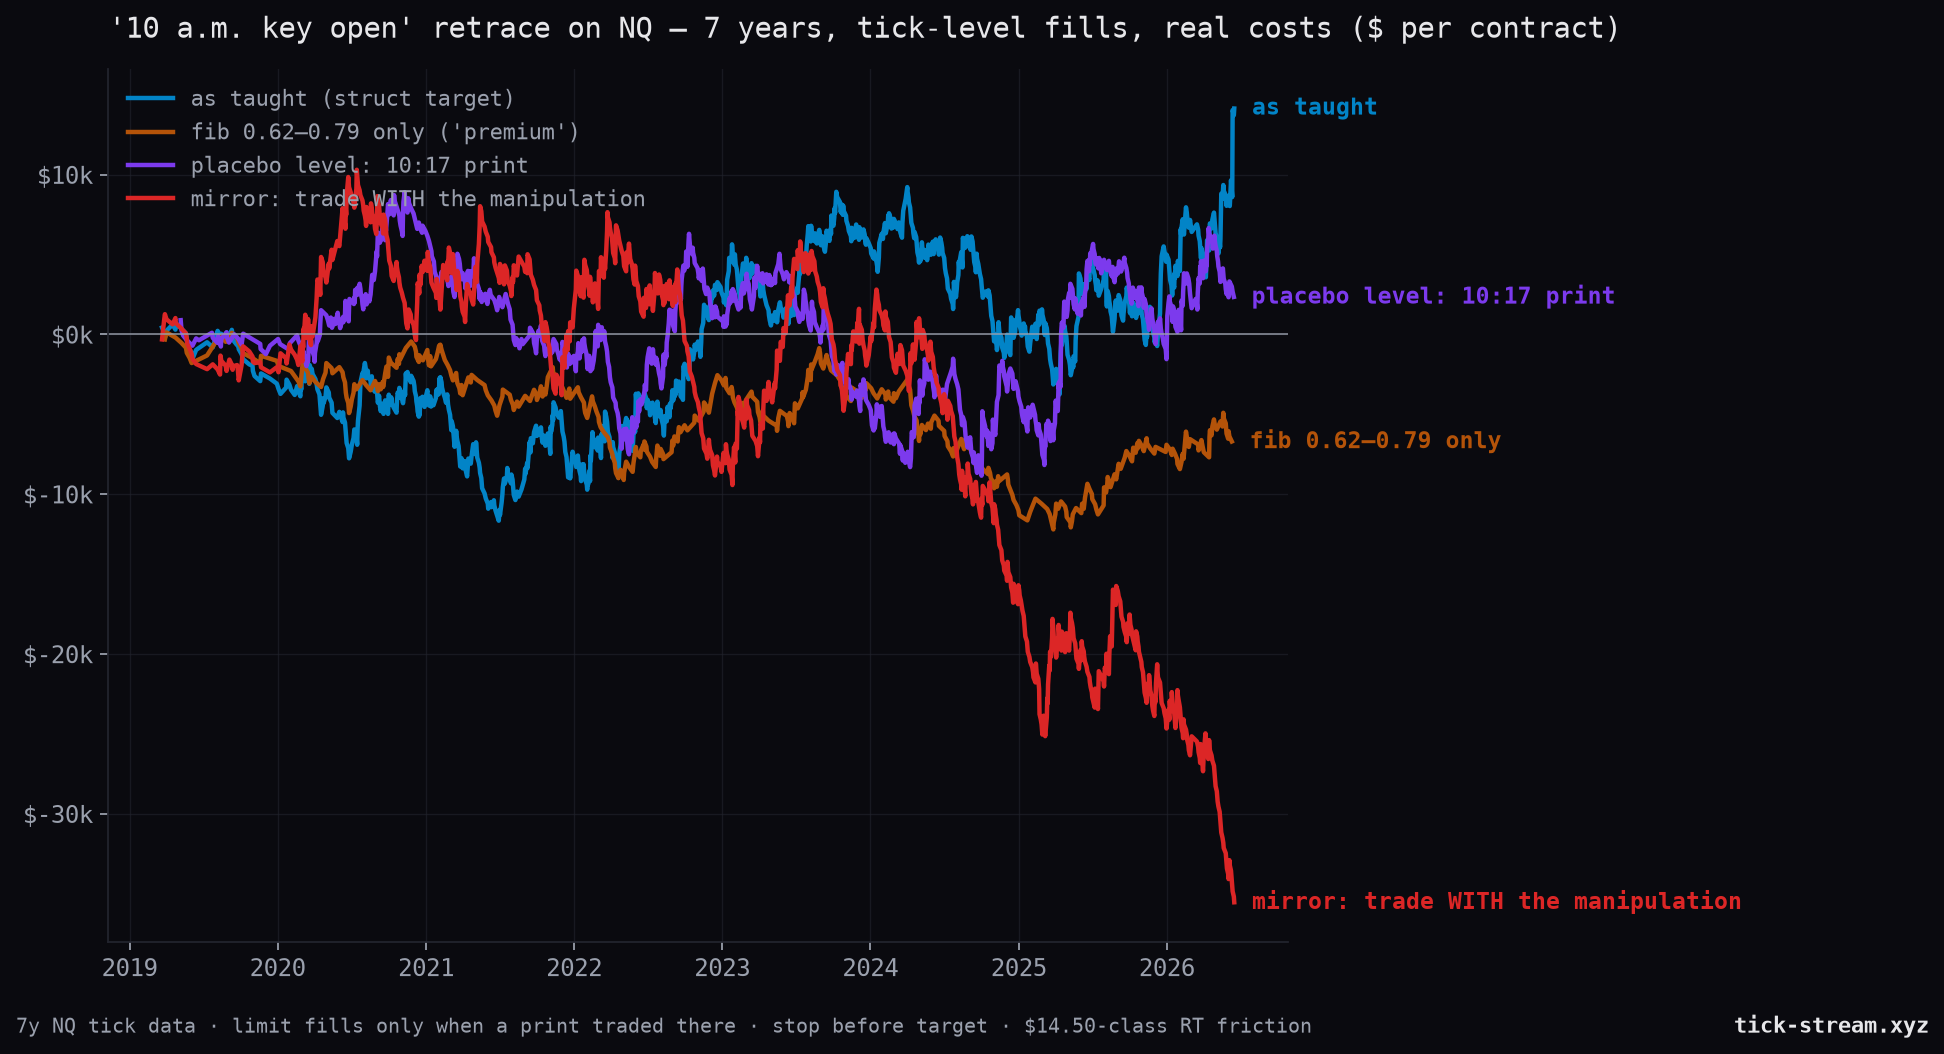
Mechanized exactly as taught (manipulation ≥5 points, displacement ≥20, limit at the open, 15-point stop, one trade a day, 10:00–12:00 entries, flat at 16:00), the strategy produced 1,153 trades:
| Exit | Net (7 years, per contract) | Win rate | t |
|---|---|---|---|
| First internal low (his “conservative target”) | +$14,132 | 33.5% | 0.78 |
| 1:4 | +$16,878 | 22.9% | 0.79 |
| 1:6 | +$27,200 | 17.6% | 1.04 |
Our bar for “real” is |t| > 2. Nothing here comes close, no year gets there on its own, and the best cell in the whole parameter grid (the wider 25-point stop) reaches t = 1.52 — as the best of six cells, which is exactly how selection noise looks.
The level is a placebo
Here’s the test that decides whether “key” means anything: run the identical machine on the price printed at 10:17 a.m. — a moment no candle opens on, no one marks, no one watches.
Real 10:00 key open, 1:4 exit: +$16,878 (t = 0.79). The 10:17 print: +$15,343 (t = 0.75).
Indistinguishable. Whatever residual drift the machine earns, it earns it from the shape of the entry — buy a retracement after a directional displacement in the most liquid morning hours — not from the sanctity of the level. (The 11:03 placebo loses money, by the way. That’s not evidence for key opens either; it’s evidence that lunch is lunch, which our session audit has measured to death.)
And the mirror control — trading with the manipulation instead of against it — bleeds $35.5k. The video’s directional instinct points the right way; the coin just doesn’t pay either side reliably.
The fib makes it worse — again
The video’s centerpiece is the confluence: the key open aligning with the 0.62–0.79 band, “the most premium entry that I’m going to get.” We tagged every trade with the exact retracement depth of the entry within the manipulation-to-displacement leg.
Trades in the premium band (478 of them): −$6,705 (t = −0.69) — while the unfiltered set made +$14k. The filter that is supposed to select the best entries selects worse ones. If this sounds familiar, it’s because it’s the third time this exact result has shown up in our data: when we dissected ICT’s OTE, the continuation effect was real and the Fibonacci placement was irrelevant — the shallow 38% band beat the “premium” 62–79% zone. Deep retracements against a fresh displacement aren’t premium entries; they’re the leg failing.
The claims, measured
“97% of 4-hour candles have wicks on the top and bottom.” True — we measured 98.1%. It is also true of essentially any four-hour window of any liquid instrument ever, because a market that spends four hours never trading both sides of one price has stopped being a market. The observation that launches the whole framework is a tautology of candle anatomy. Knowing a wick will exist tells you neither when it forms, in which order, nor from where — which is the entire trade.
“95% of the time we manipulate around the midnight open, then start the real move.” Depends entirely on what “manipulate” means: 87% of overnights trade ≥5 points on both sides of the midnight open, 74% manage ≥10, and only 54% manage ≥20. The claim is calibrated to be unfalsifiable — small excursions happen around every price.
The magnet rule is backwards. “Barely any manipulation below midnight open → use it as a target.” We distance-matched this the way our gap study taught us to: bucket sessions by how far above the midnight open they stood at 09:30, then compare touch rates for low-manipulation vs normal nights within each bucket. Within 20 points: quiet nights touched the level 72% of the time, normal nights 91%. At 20–40 points: 62% vs 77%. The conditioning signal points the wrong way — and the impressive base rates (“we absolutely just rushed down to midnight open”) come from distance, not from magnetism. Nearby levels get hit. That’s all that’s happening.
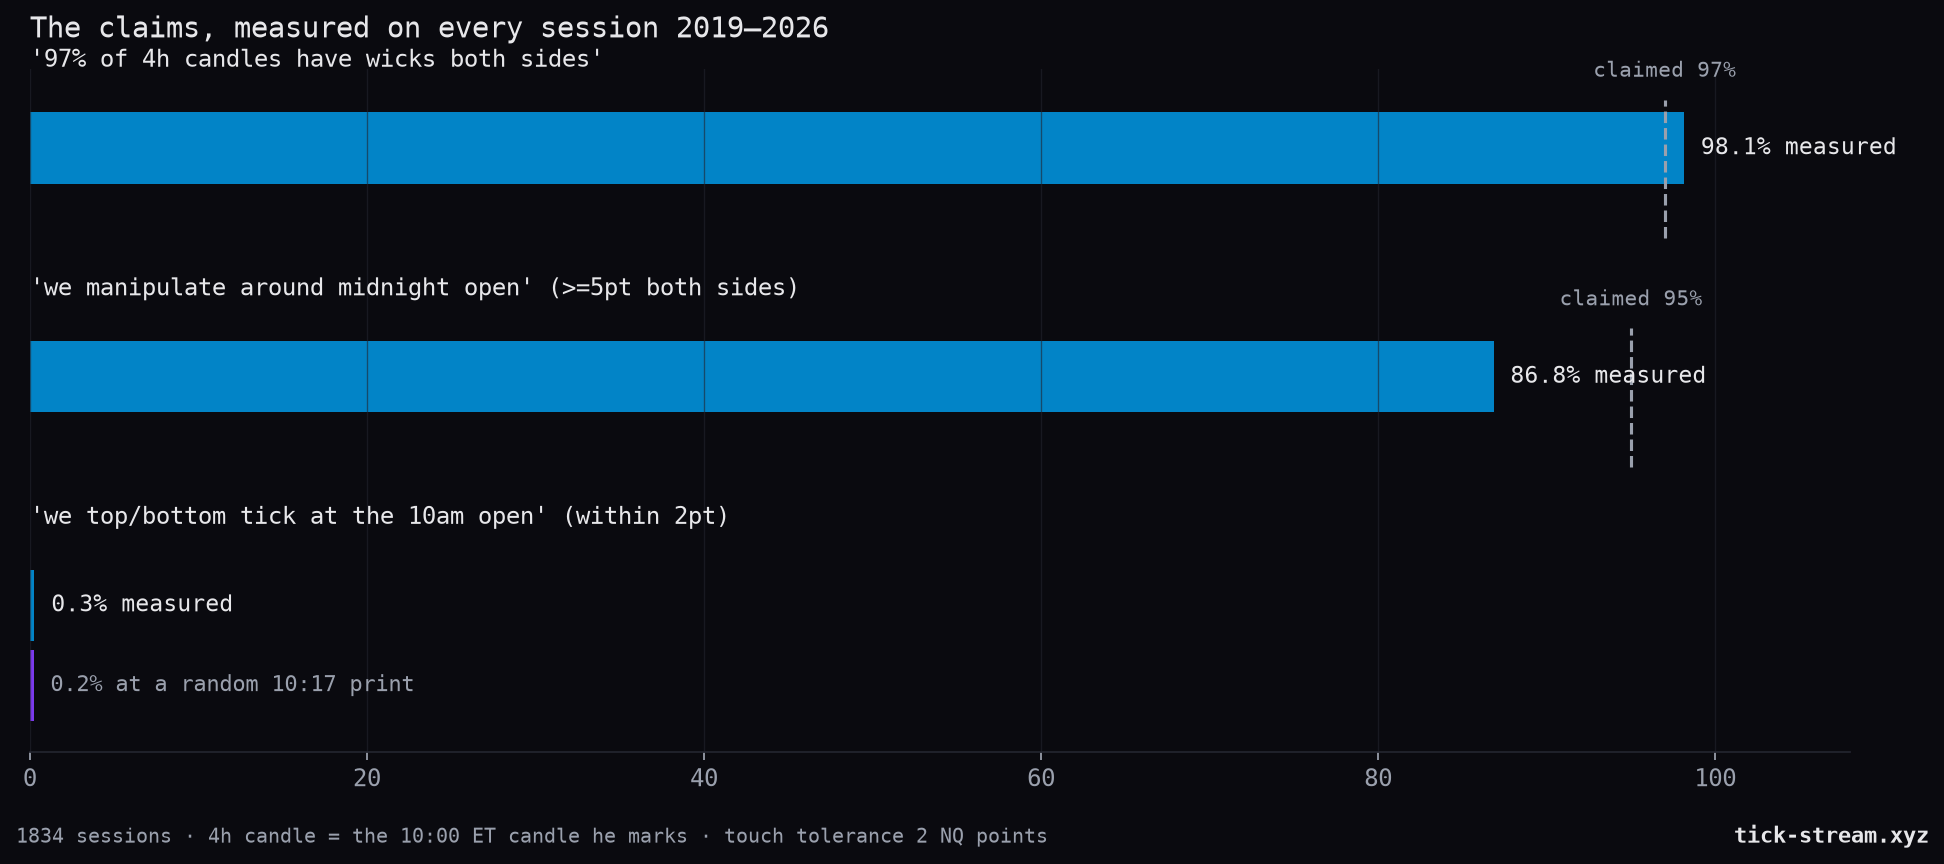
“We top and bottom tick very often at these levels.” The session’s high or low landed within 2 points of the 10 a.m. open in 0.3% of 1,836 sessions. The placebo 10:17 print: 0.2%. “Very often” is what a memorable handful of screenshots feels like from the inside. The tape says: five sessions per decade.
What’s actually in there
The honest residue is the same effect we keep excavating from underneath every one of these frameworks: entering a retracement after a directional displacement, in the liquid morning hours, carries a small positive drift — too small to clear significance here, but consistently on the right side of zero. It’s the effect that made the wickless-candle placebo profitable, it’s the honest core of OTE, and it’s what our live Slingshot sleeve trades with proper exits and a public track record — no key levels, no Fibonacci, no midnight folklore required.
Everything the video adds to that core — the sanctity of the 10 a.m. price, the premium fib band, the midnight magnet — either adds nothing (the level: placebo-identical), subtracts money (the fib filter), or points backwards (the magnet rule).
Verdict
Not a scam — a narrative. The framework organizes genuinely real-looking chart moments into a story you can only verify by measuring all of it, and measured, it’s a coin flip wearing confluences. His risk talk, for what it’s worth, is sensible: small stops, low trade frequency, walking away. Discipline again — and as we said about the cleanest zero we ever measured: discipline caps the damage; it doesn’t create the edge.
Got a strategy you want put through this? Send the complete, unfiltered rules through the strategy form. We mechanize it exactly as written, run it against 7 years of tick data with honest fills, real costs and placebo controls — and publish whatever comes out.
Frequently asked questions
Does the 10 a.m. key open strategy work on NQ futures?
Mechanized exactly as taught — price manipulates one side of the 10:00 ET open, displaces through it, then you short (or long) a limit back at the open with a 15-point stop — it produced 1,153 trades over 7 years and netted between +$14k and +$27k per contract depending on the exit, with t-statistics of 0.78 to 1.04. Below 2, that is statistically indistinguishable from zero. No single year reaches significance either.
Is the 10 a.m. open price itself special?
No. We ran the identical machine on the price printed at 10:17 — a level nobody marks, nobody watches, and no 4-hour candle opens on — and got +$15.3k (t=0.75) against the real key open's +$16.9k (t=0.79) on the same exit. If the specific level carried information, the real open would have to beat the arbitrary print. It doesn't. The residual drift comes from the retracement-continuation structure of the entry, not from the level.
Does the Fibonacci 0.62–0.79 'premium' filter improve the entries?
It makes them worse. Trades where the key open sat in the 0.62–0.79 band of the manipulation-to-displacement leg — the video's 'most premium entry' — lost $6.7k over 7 years while the unfiltered set made money. This replicates what we found dissecting ICT's OTE directly: the continuation effect is real, the Fibonacci location of the entry adds nothing, and selecting for the 'premium' zone actively filters toward the deeper retracements that fail more often.
Is the midnight-open 'magnet' rule real?
It's backwards. The rule says: little or no overnight manipulation below the midnight open means price will be drawn back to it during the day. Distance-matched on 7 years of sessions that opened above the midnight open, days with small overnight manipulation touched the level LESS often than days with normal manipulation — 72% vs 91% within 20 points, 62% vs 77% at 20–40 points. What the claim gets right is trivial: nearby levels get touched a lot. That's distance, not magnetism — the same illusion we measured in our opening-gap study.
But the 4-hour candles really do have wicks on both sides, right?
Yes — 98.1% of 10:00 ET 4-hour candles wick both sides of their open, even better than the claimed 97%. It's also true of essentially any 4-hour window of any liquid future, because a market that never traded both sides of a price for four straight hours would barely be a market. A claim that is true of everything predicts nothing: knowing a wick will exist tells you neither when, in which order, nor from where.
Can I submit my own strategy to be backtested?
Yes — send the full, unfiltered rules (entries, exits, stops, session, timeframe, management) through the strategy form on tick-stream.xyz/request-market?topic=strategy. We mechanize submissions exactly as written, run them on 7 years of real tick data with honest fills, real costs and placebo controls, and publish the results — whatever they show.