Higher-Timeframe Bias, Daily Sweeps and Unmitigated Levels All Fail on 12.5 Years of ES
Three structure claims, one assumption: that what you read on the daily tells you something about the next session. On 3,224 ES sessions the higher-timeframe bias read is right 50.2% of the time, p = 0.8927, and trading it loses $71.97 a session against an always-long baseline that loses $6.23. The daily sweep reversal loses $46.62 a trade at t = −3.49, and its continuation mirror loses $23.05 — both sides of the same signal paying costs. And across 30,277 unmitigated levels, four of five distance buckets are indistinguishable from an equally distant price with no story attached.
We tested three structure claims on 3,224 ES sessions, 2 January 2014 to 10 September 2026. All three failed. Each one failed in a different way, and the differences are the reason this article is longer than one line.
The claims share an assumption: that structure read on a higher timeframe tells you something about the lower one. A higher-high/higher-low read gives you a bias. A sweep of yesterday’s extreme gives you a reversal. An untouched prior level gives you a destination. None of the three survives being asked what happens next.
The rule
Three tests, one archive, one cost model.
- ES continuous front-month. Daily bars for the bias test, RTH one-minute bars for the sweep and the level test.
- Swing points. A swing high is the highest bar of a seven-bar window, confirmed three bars either side. Swing lows mirrored.
- Bias. Bullish when the last confirmed swing high sits above the one before it and the last swing low sits above the one before it. Bearish is the mirror. Everything else is no bias. Both swing series are lagged one bar, so nothing is read before it is confirmed.
- Bias trade. Enter at the next session’s open in the bias direction, exit at that session’s close. One contract.
- Daily sweep. Price trades through the prior RTH session’s high or low and the same minute closes back inside it. Entry at that minute’s close, against the sweep. First occurrence per session only.
- Sweep bracket. Stop at 20% of the prior session’s range, target at 40%, out after 180 minutes.
- Continuation control. Same trigger, same minute, same bracket sizes, traded the other way as its own trade with its own costs.
- Unmitigated level. Looking back 20 sessions from the open, a prior session high that no later session in that window traded above. Lows mirrored. Levels within 2 points of the open are dropped.
- Mirror control. For every level, a price the same distance from the open on the opposite side. Hit means the session reached it.
Costs are $4.50 commission plus two ticks of slippage per round trip. An ES tick is $12.50, so $29.50 comes off every trade in every table below.
1. The bias read is a coin with 1,979 flips behind it
1,979 of the 3,224 sessions carried an unambiguous read — 1,300 bullish, 679 bearish. The next session closed in the direction of that read 50.2% of the time.
That is p = 0.8927. The 95% confidence interval runs from 47.9% to 52.4%.
The chart puts the read next to a coin, with the 95% interval drawn on the bar and printed clear of it. What matters is not the height of the bar but the width of the error line, and whether 50 sits inside it.
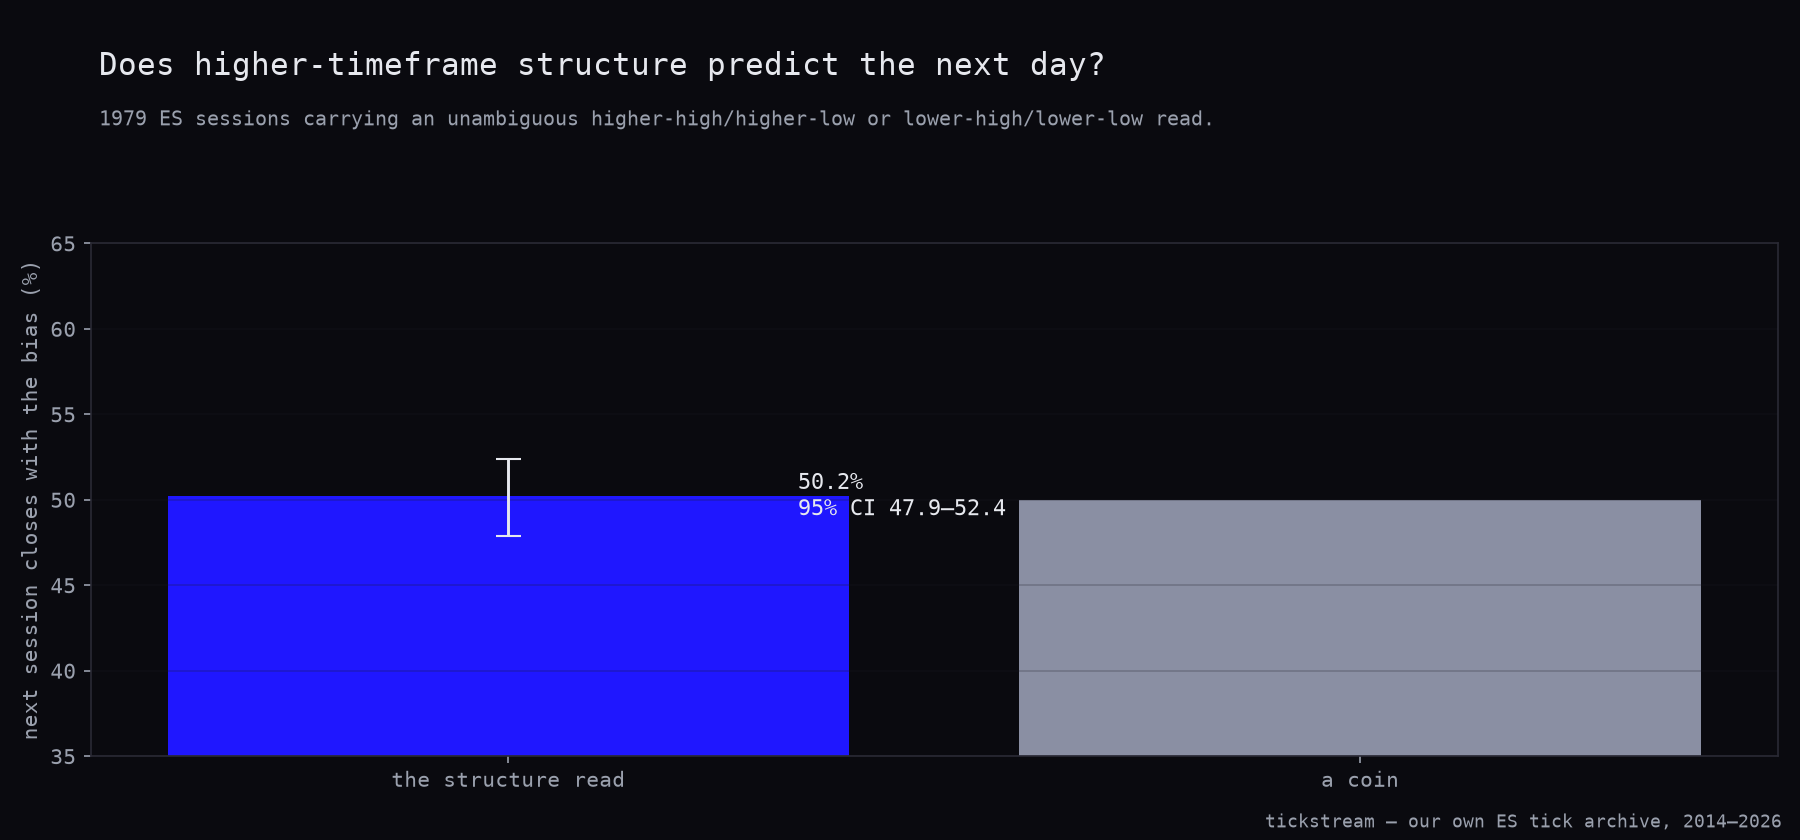
It does, comfortably. What a sample of nearly two thousand sessions can resolve is an edge of roughly five percentage points, and no finer. The interval runs 2.3 percentage points either side of the read, so anything smaller than that hides inside it and this test cannot speak to it.
Trading it makes the null concrete, and it does something a null result usually cannot: it costs more than doing nothing.
| Follow the bias | Fade the bias | Always long, same days | |
|---|---|---|---|
| Trades | 1,979 | 1,979 | 1,979 |
| Win rate | 48.7% | 47.0% | 52.0% |
| Average per trade | −$71.97 | +$12.97 | −$6.23 |
| Median trade | −$17.00 | −$42.00 | +$33.00 |
| Total, one contract | −$142,430.50 | +$25,669.50 | −$12,330.50 |
| Profit factor | 0.872 | 1.025 | 0.988 |
| Max drawdown | $149,079.50 | $76,949.00 | $82,454.50 |
| Sharpe | −0.68 | +0.12 | −0.06 |
| t | −1.90 | +0.34 | −0.16 |
| p | 0.0578 | 0.7323 | 0.8695 |
Read the fade column first, because it is the one people misread. It makes $12.97 a trade at t = 0.34. That is not an edge. It is the mirror image of a cost, and a mirror image of a cost is what a fade always looks like when the underlying signal is empty.
The column that settles the question is the third one. Buying every one of the same 1,979 sessions and holding to the close loses $6.23 a trade. Following the bias on those identical sessions loses $71.97. The bias is roughly $66 a trade worse than having no opinion at all, and the reason is arithmetic rather than mystery: 679 of the reads were bearish, they were sold, and the S&P drifts up.
That is what a directional view costs when the view carries no information. It does not cost you nothing. It costs you the drift you gave away, plus the round trips.
Our NQ run of the same structure read found it pointing backwards on the Nasdaq. On ES it points nowhere. The flat outcome is the more common one, and the more boring one, and five extra years of tape is what makes it worth stating with a confidence interval instead of a shrug.
2. Both sides of the daily sweep lose
The sweep is the cleanest failure of the three, because the control is the same trade in the other direction.
1,985 sessions produced a sweep of the prior session’s high or low with a close back inside. Trading the reversal wins 33.0% of the time and loses $46.62 a trade.
| Sweep reversal | Sweep continuation | |
|---|---|---|
| Trades | 1,985 | 1,985 |
| Win rate | 33.0% | 34.1% |
| Average per trade | −$46.62 | −$23.05 |
| Median trade | −$142.00 | −$132.00 |
| Total, one contract | −$92,545.00 | −$45,762.50 |
| Profit factor | 0.799 | 0.898 |
| Max drawdown | $100,221.00 | $57,552.00 |
| Sharpe | −0.98 | −0.47 |
| t | −3.49 | −1.68 |
| p | 0.0005 | 0.0924 |
| Exits: stop / target / timeout | 1,236 / 474 / 275 | 1,238 / 479 / 268 |
The reversal’s exit mix is the story in three numbers. 1,236 of 1,985 trades end on the stop against 474 that reach the target, on a bracket that needs roughly one in three to pay for itself before costs. It is short of that, and the shortfall is what t = −3.49 measures.
Then the continuation. Identical signal, identical minute, opposite side, its own bracket and its own $29.50. It loses too, $23.05 a trade.
Both directions losing on the same trigger is the signature of a signal with no information in it, sitting on top of transaction costs. If the sweep were merely backwards, one of these two columns would be green. Neither is.
This is why we simulate the opposite side as a real trade instead of flipping the sign on the P&L. Negating a loss of $46.62 does not give you the other side of that trade. It gives you $46.62 of profit that includes the costs you already paid, turned inside out into income. The bracket has to be re-run, the stop has to be hit on its own terms, and the commission has to come off again. Do it properly and the continuation loses $23.05. Do it by negation and it appears to make money it never had access to.
Our NQ sweep test killed the same mechanic on seven years. ES adds five and a mirror.
3. Unmitigated levels, and the arrow pointing the wrong way
The draw-on-liquidity claim is that price is pulled toward levels it has not yet reached. We found 30,277 such levels: prior session extremes that no later session in a 20-day window had traded through. Of each we asked one question. Was it reached more often than an equally distant price on the other side of the open, with no story attached to it?
| Distance from the open | Levels | Level reached | Mirror reached | Difference | t | p |
|---|---|---|---|---|---|---|
| 2–10 pt | 3,257 | 62.5% | 62.3% | +0.2 pp | 0.15 | 0.8781 |
| 10–20 pt | 3,343 | 31.8% | 32.5% | −0.7 pp | −0.65 | 0.5128 |
| 20–40 pt | 5,479 | 15.9% | 15.7% | +0.2 pp | 0.31 | 0.7531 |
| 40–80 pt | 6,831 | 6.2% | 5.0% | +1.2 pp | 3.06 | 0.0022 |
| 80 pt+ | 11,367 | 0.7% | 0.7% | −0.0 pp | −0.08 | 0.9373 |
The chart pairs each level with its mirror. The two bars in each pair are the whole test, and the level counts are printed below the axis.
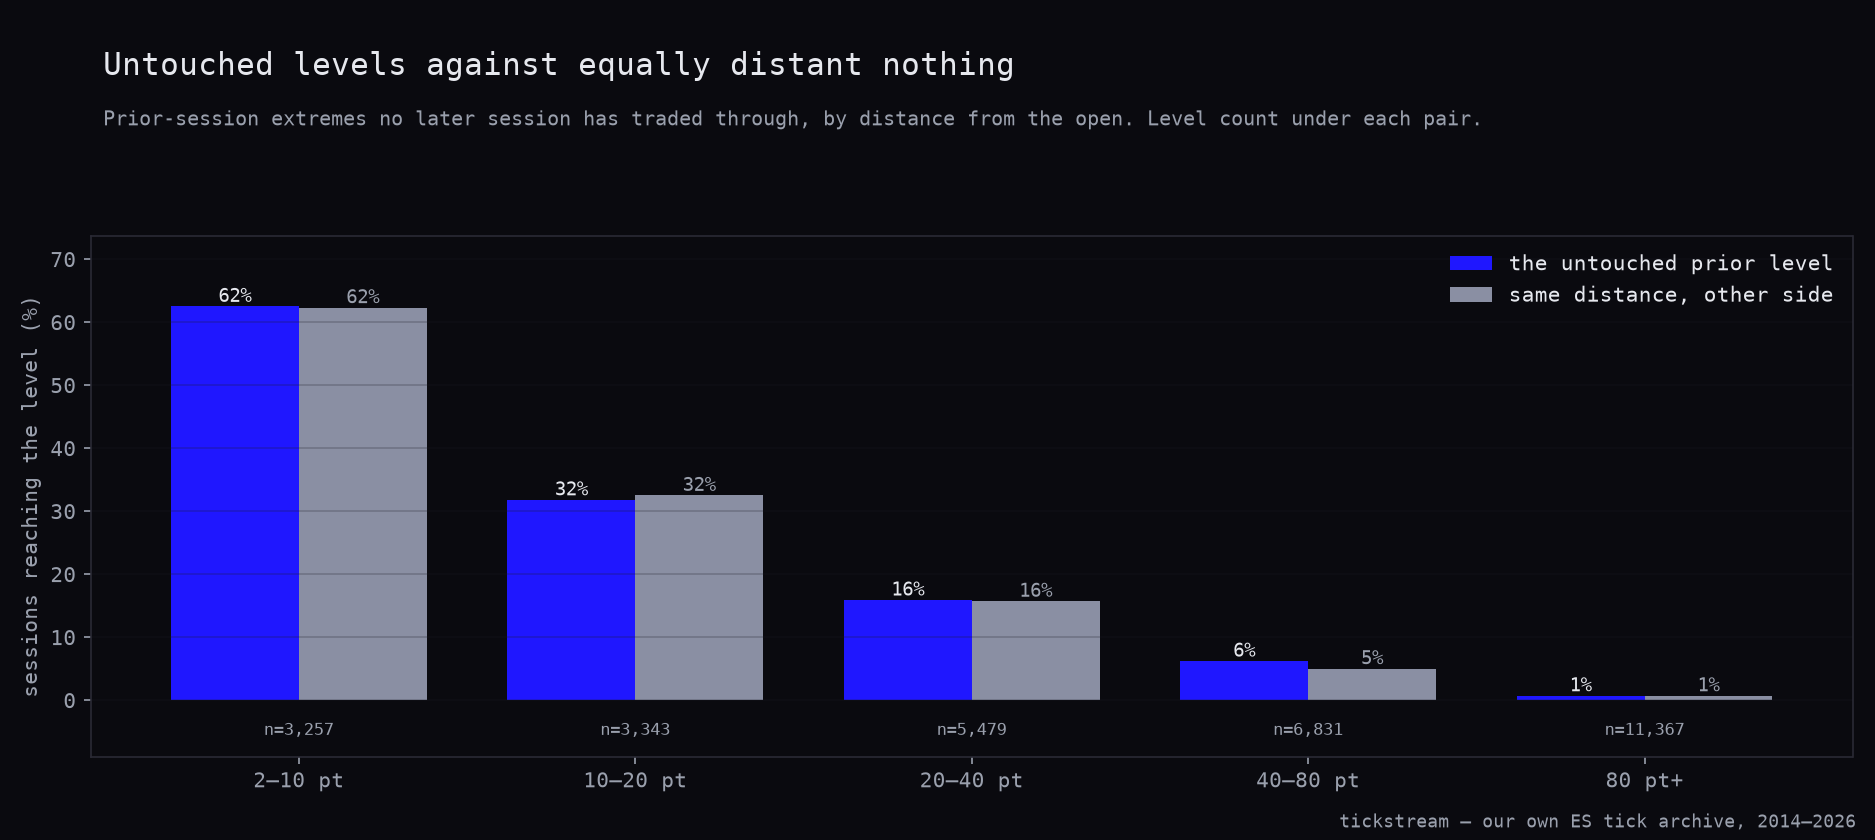
Four of five pairs are the same height. The fourth is not: 40 to 80 points out, the untouched level is reached 6.2% of the time against 5.0% for the mirror, t = 3.06, p = 0.0022.
We are not going to pretend that bucket is nothing, and we are not going to pretend it is something. It is one bucket out of five tested, which is the point at which a p-value of 0.0022 stops meaning what it says on the tin. And the effect is 1.2 percentage points on an event that happens 6.2% of the time. There is no bracket, no stop and no target that turns “reached slightly more often than a level you made up” into money at $29.50 a round trip.
The arrow
The deeper problem is not the size of the effect. It is the direction of the reasoning.
A level is called unmitigated because price has not gone there. That is the definition, not a finding. Then the claim takes that definition and reads it forward: because price has not gone there, price will go there.
That is cause and effect swapped. Every level on a chart that has not been reached is, trivially, a level that has not been reached. Point at the ones price later visits and the concept looks predictive. Point at them before, and you are pointing at a population selected for the very property you are about to explain.
The only version of the claim that can be false is the comparative one: is an unmitigated level reached more often than an equally distant price nobody has named? That is the test above, and on ES the answer is no in four buckets out of five.
Our NQ version of this test found far levels were reached less often than chance. ES is flatter than that — the 80-point-plus bucket differs from its mirror by 0.0 percentage points. Flatter is a weaker result in the same direction, and the extra five years of S&P tape is what lets us say so with 11,367 levels in that bucket alone.
What we changed in our own book
Nothing, which is the honest answer, but the reasons are worth recording.
- The higher-timeframe bias filter is removed from consideration, not shelved. We have now measured it on two indices. It is backwards on one and a coin on the other, and on ES it is $66 a trade worse than having no opinion. There is no filter parameter to tune here, because there is no signal underneath the parameter.
- The mirror-trade control is now standard for any reversal claim. The sweep would have looked like a directional mistake without it. With it, it is a dead signal. Any test in this series where a strategy loses and the obvious response is “so fade it” now gets the fade run as its own trade, with its own bracket and its own costs.
- The 40 to 80 point bucket is logged and closed. One bucket in five at 1.2 percentage points is not something we will build on, and re-testing it with a narrower bucket would be searching for the boundary that keeps it alive.
What the three claims have in common is that each describes the past accurately. A higher-high/higher-low sequence is a true statement about the bars behind it. A sweep is a true statement about a minute that already closed. An unmitigated level is a true statement about where price has not been.
All three are correct. None of them is predictive. That distinction is not a technicality, and it is what the controls in this article exist to expose.
The ES archive these ran on, with an aggressor side on every print back to 2014, is in our historical data packages.
Methodology: ES continuous front-month, 3,224 sessions from 2 January 2014 to 10 September 2026. Daily bars for the bias test, RTH one-minute bars for the sweep and level tests. Swing points confirmed three bars either side, both series lagged one bar. Bias trade entered at the next session’s open, exited at its close, one contract. Daily sweep = trade through the prior RTH session’s high or low with a close back inside on the same minute, entry at that close, first occurrence per session, stop at 20% of the prior session’s range, target at 40%, timeout 180 bars. The continuation control uses the identical trigger and bracket on the opposite side, simulated as its own trade rather than by negating P&L. Unmitigated levels drawn from a 20-session lookback, prior extremes no later session in the window traded through, levels within 2 points of the open excluded; each tested against a price at equal distance on the opposite side of the same open. Costs $4.50 commission plus two ticks of slippage per round trip, $29.50 on ES. Sharpe is per-trade, annualised by trade count. The NQ comparisons come from our earlier seven-year runs of the same three concepts.
Frequently asked questions
Does higher-timeframe bias predict the next session on the S&P 500?
No. Across 1,979 ES sessions carrying an unambiguous higher-high/higher-low or lower-high/lower-low read, the next session closed in the bias direction 50.2% of the time, p = 0.8927. The 95% confidence interval runs from 47.9% to 52.4%, which contains a coin and nothing more interesting.
Is trading with the daily bias better than just being long?
It is measurably worse. Following the bias loses $71.97 a session over 1,979 trades; always going long on those same 1,979 sessions loses $6.23. That gap of roughly $66 a trade is what a directional view costs when the view carries no information.
Why test the continuation side of a daily sweep at all?
Because it is the only way to tell a bad direction from a dead signal. The reversal loses $46.62 a trade and the continuation, taken at the identical minute with its own bracket, loses $23.05. Both sides losing on the same trigger means the signal carries no direction and the $29.50 round-trip cost is what you are measuring.
Are unmitigated levels really magnets for price?
Not on ES. Four of the five distance buckets across 30,277 levels match their mirror within 0.7 percentage points, with p-values from 0.5128 to 0.9373. The one exception, 40 to 80 points out, is reached 6.2% of the time against 5.0% for an equally distant price with no story attached.
Does the ES result match your earlier NQ run?
It is the same verdict, arrived at more flatly. On NQ the higher-timeframe structure read pointed backwards and far levels were reached less often than chance; on ES the read is a coin at 50.2% and the 80-point-plus bucket differs from its mirror by 0.0 percentage points. Same conclusion, less drama, five more years of tape.