Order-Book Imbalance Predicts ES on 73 of 76 Sessions and Pays a Third of the Spread
We measured top-of-book imbalance against the forward mid on 20,223,385 ES level-2 snapshots from our own depth recording, 76 trading sessions between 16 June and 11 September 2026. The correlation is 0.1433 at one second, 0.0876 at five and 0.0398 at thirty, and 73 of 76 sessions are positive. After a strongly bid-heavy book the mid rises 0.3354 ticks over the next 30 seconds, which is $4.19, against a median crossing cost of $12.50. The signal is real, robust, and belongs to whoever is already resting on the bid.
Top-of-book imbalance on the S&P futures correlates 0.1433 with where the mid goes one second later, across 20,223,385 book snapshots. It holds on 73 of 76 sessions. And the best forward move it produces is 0.3354 ticks, against a median cost of one full tick to cross the spread twice.
That is the whole article. This is not a kill — the signal is real and it survives every robustness check we put on it. It is simply worth about a third of what a taker pays to reach it. Most of this series kills ideas for not being real. This one is real and unreachable, which is a different failure and worth writing down separately.
The data, and its limit
Everything below comes from our own ES level-2 recording: 20,223,385 top-of-book snapshots over 76 sessions, from 16 June to 11 September 2026. That count is the snapshots that still have a price thirty seconds later, which is why our spread study quotes 20,230,919 for the same recording over the same window. It counts every snapshot; this one counts the ones the forward move can be measured on. The gap between the two is 7,534 snapshots with nothing to compare against.
Six partitions came out before any of that was measured. The store holds 82 date partitions and six of them are weekends, where the recorder keeps writing while the market is shut. The book sits frozen at a single mid for 24 hours. A quote that never changes is not a price anyone could have traded against, and a series with no variance has no correlation at all, so the daily figure for those days is undefined rather than zero. Dropping them is what leaves 76 sessions. It also raised every correlation in this article, because the frozen rows were dead weight pulling the averages toward zero. The first version of this piece included them and understated the effect.
That window is short, and we would rather say so at the top than bury it under a decile table. Our tick archive on ES goes back to 2014. Our depth recording does not — it started when we started capturing the full book ourselves, and 76 sessions is what exists. Nothing here is a twelve-year finding. Depth data of this kind is not sold in twelve-year form at retail prices by anyone, which is why the test is worth publishing at 76 sessions, and also why the sample is the honest constraint on every number that follows.
One method choice matters enough to state before the results. Book snapshots arrive irregularly — a burst of updates in a busy second, nothing for a while in a quiet one. So the forward price at +1s, +5s and +30s is taken with an as-of join on the timestamp, not by shifting rows. Shifting rows would compare a one-second horizon in a fast market against a thirty-second one in a slow market and call both the same number.
The rule
- Imbalance is bid size minus ask size at the best quote, scaled so it runs from −1 (all ask) to +1 (all bid).
- The five-level version is the same quantity summed over the five nearest price levels on each side.
- The forward move is the change in the mid, expressed in ticks. One ES tick is $12.50.
- Horizons are +1, +5 and +30 seconds, each taken by as-of join from the snapshot’s own timestamp.
- Weekend partitions where the book is frozen at one price are excluded before anything is computed.
- Nothing is traded. No entry, no stop, no commission — there is no completed round trip anywhere in this test.
The signal, and how fast it dies
| Imbalance measured at | +1 second | +5 seconds | +30 seconds |
|---|---|---|---|
| Top of book | 0.1433 | 0.0876 | 0.0398 |
| Five levels deep | 0.0604 | — | 0.0191 |
Two things in that table are worth more than the headline number.
The decay is the shape a real microstructure effect has. Information sitting in the queue at the best price is consumed by the trades that arrive over the next few seconds, so the correlation should fall as the horizon lengthens, and it does — 0.1433, then 0.0876, then 0.0398. A signal that held its strength out to thirty seconds would be more suspicious, not less.
Going deeper makes it worse. Five levels of depth correlate 0.0604 with the next second against 0.1433 for the top alone, and the gap survives to thirty seconds. That is not a measurement problem. Size resting behind the best price is mostly cancellable intent: it can be pulled at no cost the moment the market moves toward it. Size at the best price is next in line to be filled. Only one of those is a commitment, and the correlations rank them correctly.
The gradient
We sorted all 20.2 million snapshots into ten equal buckets by imbalance.
| Decile | Snapshots | Mean imbalance | +1s (ticks) | +5s (ticks) | +30s (ticks) | Mean spread (ticks) |
|---|---|---|---|---|---|---|
| 1 (most ask-heavy) | 2,022,339 | −0.7281 | −0.2717 | −0.2814 | −0.2635 | 1.011 |
| 2 | 2,022,339 | −0.4773 | −0.1499 | −0.1670 | −0.1811 | 1.323 |
| 3 | 2,022,339 | −0.2990 | −0.1062 | −0.1231 | −0.1325 | 1.080 |
| 4 | 2,022,339 | −0.1452 | −0.0476 | −0.0511 | −0.0545 | 1.186 |
| 5 | 2,022,339 | −0.0253 | −0.0045 | −0.0029 | −0.0050 | 2.792 |
| 6 | 2,022,338 | +0.0560 | +0.0685 | +0.0745 | +0.0693 | 1.918 |
| 7 | 2,022,338 | +0.1879 | +0.0785 | +0.0974 | +0.1062 | 1.166 |
| 8 | 2,022,338 | +0.3497 | +0.1413 | +0.1701 | +0.1735 | 1.063 |
| 9 | 2,022,338 | +0.5019 | +0.1167 | +0.1329 | +0.1405 | 2.867 |
| 10 (most bid-heavy) | 2,022,338 | +0.7262 | +0.2866 | +0.3284 | +0.3549 | 1.015 |
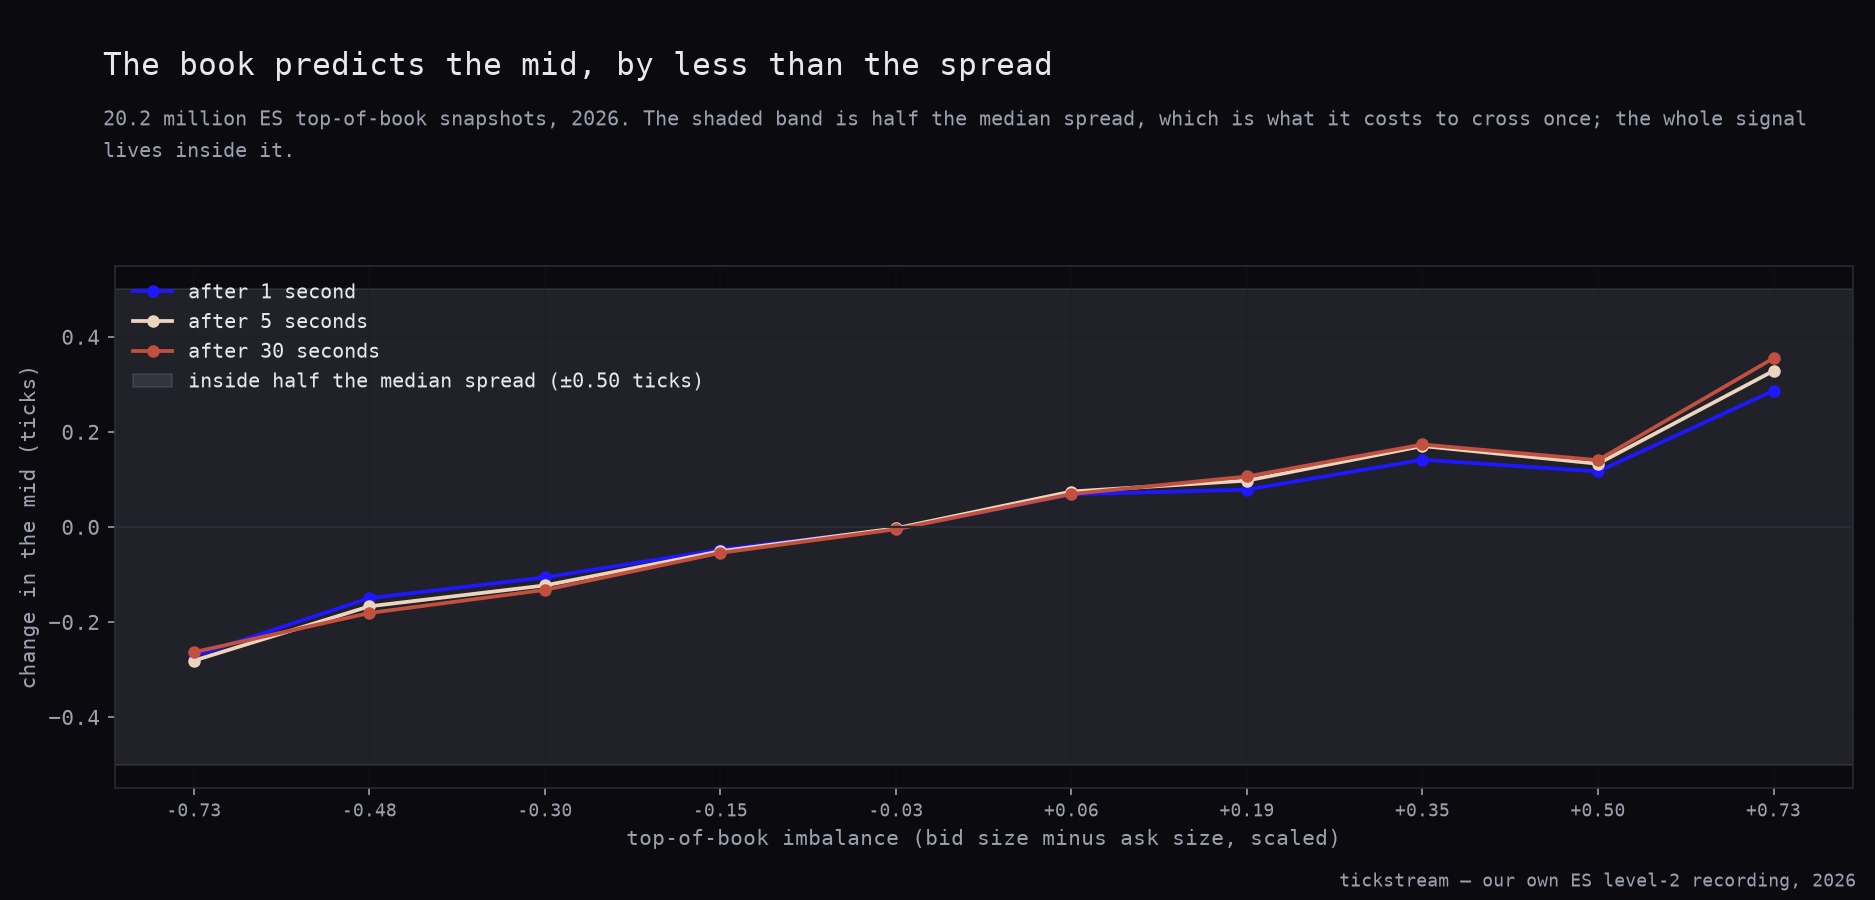
The extremes are clean. The most ask-heavy decile, mean imbalance −0.7281, is followed by −0.2717 ticks one second later. The most bid-heavy, +0.7262, by +0.2866 ticks. The middle sits near zero, and across the whole table the ordering breaks in exactly one place.
That place is decile 9. Its imbalance is stronger than decile 8’s and its forward move is weaker: +0.1167 at one second against +0.1413 in the bucket below it. Its mean spread is 2.867 ticks, against roughly one tick through most of the table. So the single break in the gradient is a wide-spread bucket, which is the reading we would have predicted.
The rest of that reading did not survive the correction, and we are going to say so rather than quietly restate it. Deciles 5 and 6 also carry wide spreads, 2.792 and 1.918 ticks, and both of them behave. Decile 5 has a mean imbalance of −0.0253 and a forward move of −0.0045 ticks — small, correctly signed, precisely what a near-balanced book should do. In the version of this article that still included the frozen weekend partitions, that bucket came out inverted and we wrote a paragraph explaining the inversion. There was no inversion. There was a contaminated bucket. The claim we can actually defend is the narrower one: a wide book is where imbalance gets unreliable, and it takes a wide book and a strong imbalance, which is decile 9, before the gradient stops working altogether.
The chart puts all three horizons on the deciles at once, with a shaded band marking half the median spread — the cost of crossing once. The point of the band is that the entire signal, at every horizon, lives inside it.
The arithmetic that decides it
Take the strong signals only. Imbalance above +0.5 covers 2,497,020 snapshots, and after those the mid rises 0.3354 ticks over the next thirty seconds. Imbalance below −0.5 covers 2,510,446 snapshots, and the mid falls 0.2559 ticks. The two tails are close to even in size and cover 24.76% of the sample between them.
Now the cost side. The ES book is one tick wide on 80.95% of snapshots and the median spread is exactly 1.0 tick. A taker pays half that spread to get in and half to get out, one full spread over the round trip.
| Ticks | Dollars, one contract | |
|---|---|---|
| Best-case forward move (30s, bid-heavy) | +0.3354 | $4.19 |
| Taker round trip at the median spread | −1.0000 | −$12.50 |
| Net | −0.6646 | −$8.31 |
The mean spread across all snapshots is 1.542 ticks, or $19.28 to cross. We used to attribute the gap between that mean and the one-tick median to thin overnight trading, and the spread study says that is wrong. The quiet European pre-dawn hours are the tightest block on the whole clock, bottoming at 1.111 ticks in the 07:30 half-hour. What lifts the mean is a tail rather than a time of day: four ticks or wider covers 4.81% of snapshots, and the 99th percentile spread is 14.0 ticks. The median remains the fairer number for anyone trading the session, and the fairer number still kills this.
So: the signal is real and it belongs to whoever is already resting on the bid. A maker who was going to be filled anyway collects the drift for free. A taker pays roughly three times the drift for the privilege of chasing it.
We are not dismissing the maker case, because the queue is not long. The median top-of-book size is 24 contracts, so a resting order does not have to outlast hundreds of others to reach the front. That makes the maker version worth testing. We have not tested it, and we are not going to imply a result we do not have.
Robustness is not the problem here
Across the 76 sessions the mean daily correlation at thirty seconds is 0.0453, running from −0.0189 to 0.1203, with 73 of 76 sessions positive. The chart below is one bar per session, in date order, with the three negative sessions marked below the axis so they are not lost at this scale.
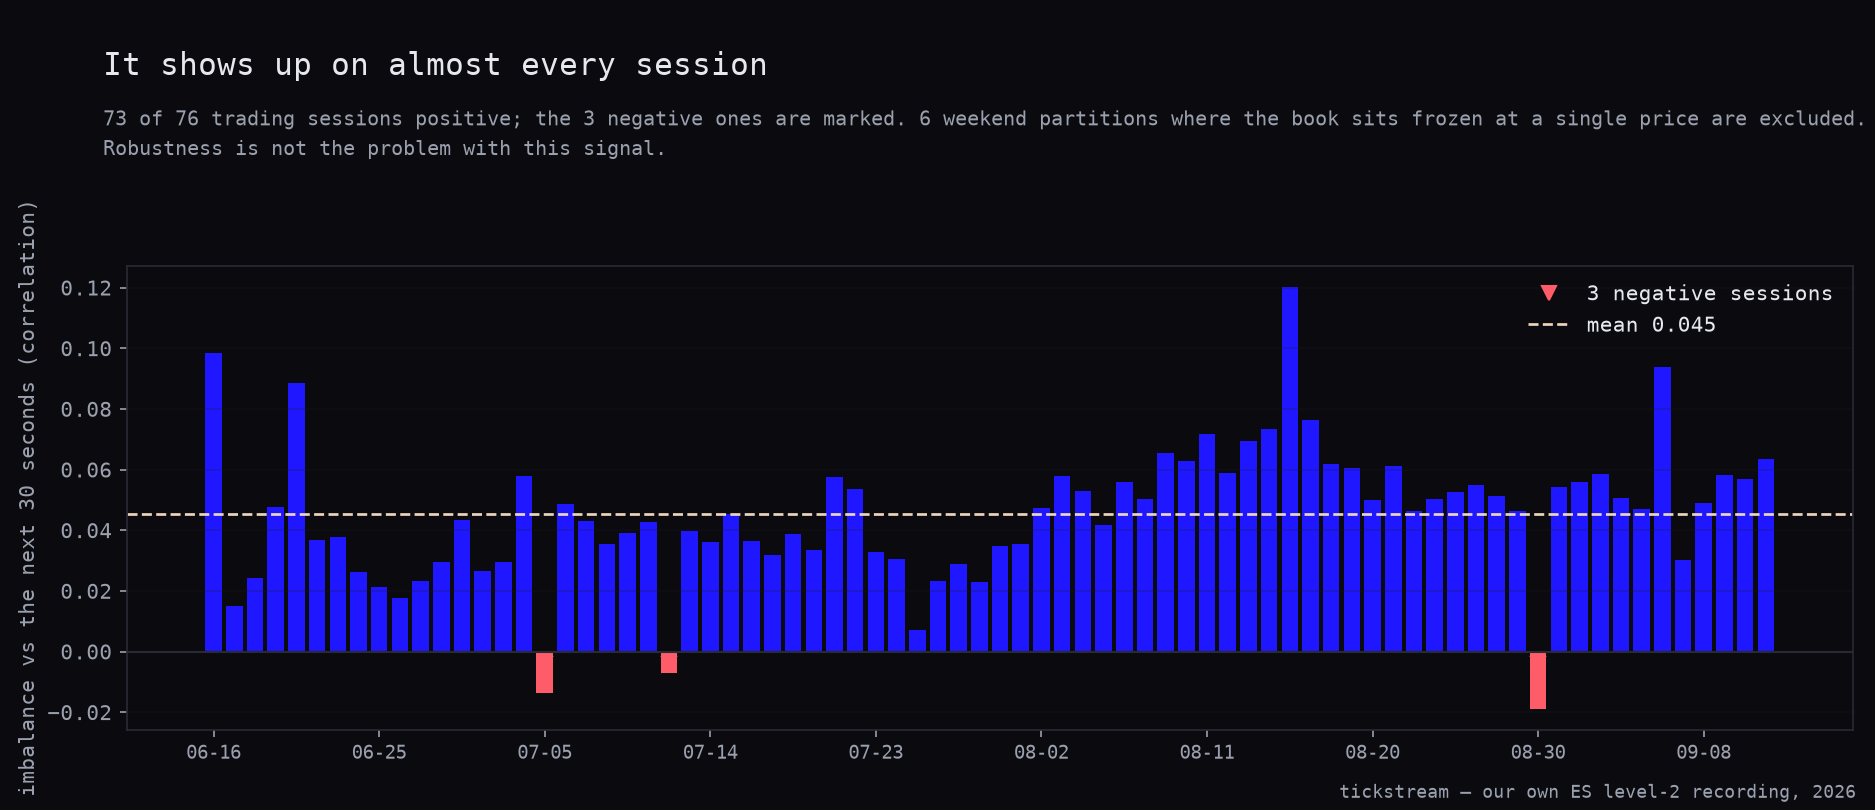
There is no regime here, no single week doing the work, no sign flip between halves. If the question were “is this effect real”, the answer is yes and the evidence is boring. The problem is reachability, not robustness, and that distinction matters because almost everything else in this series dies at the first question rather than the second.
Where this fits with the rest of the series
Our order-flow indicator study on Nasdaq concluded that the honest use of flow is execution rather than direction. This is the cleanest illustration of that we have produced. A signal measured at the top of the book, decaying from 0.1433 to 0.0398 within thirty seconds, worth a fraction of a tick — that is an execution input by construction. It can tell a resting order whether to stay or pull. It tells nobody anything about where to put a stop.
The same conclusion arrived from two other directions in this series. Large prints on ES follow price rather than lead it, and absorption carries nothing beyond the bar it lives in. Three different slices of the same tape, three versions of the same answer: the flow describes what is happening, and the description is worth less than the spread.
What we changed
Nothing in the book. The maker version of this is the only interesting thing left in it, and two pieces are missing before it could be tested honestly: a fill model for resting orders, and a queue-position estimate. We have neither. Until we do, a 0.3354-tick drift measured on snapshots is not a claim about what a limit order would have earned.
What did change is the sample. Weekend partitions with a frozen book are now excluded from every level-2 test we run, here and in the spread study. It moved this article’s numbers in our favour and it moved that one’s headline by seven percentage points, and both are worth more than a silent re-render.
The ES depth this ran on, along with ticks back to 2014, is in the historical data packages.
Methodology: ES level-2 recorded by us, top of book only, 20,223,385 snapshots across 76 sessions from 16 June to 11 September 2026. Six of the 82 date partitions in the store are weekends where the book sits frozen at a single price; they are dropped before measurement. Imbalance is bid size minus ask size at the best quote, scaled to ±1; the five-level version sums the nearest five levels a side. The forward mid at +1s, +5s and +30s is taken by as-of join on the snapshot timestamp, never by shifting rows, because book updates are irregular. Everything is expressed in ticks; one ES tick is $12.50. No commission is charged anywhere in this article, because nothing here is a completed trade.
Frequently asked questions
Does order-book imbalance predict price on S&P 500 futures?
Yes, measurably. Top-of-book imbalance correlates 0.1433 with the change in the mid one second later across 20,223,385 ES snapshots, and 73 of 76 sessions carry a positive correlation at the 30-second horizon. This is one of the few signals in this series that survives its own controls.
If the signal is real, why is it not tradeable?
Because it is smaller than the spread. The best forward move we measured is 0.3354 ticks over 30 seconds, which is $4.19 on one ES contract. Crossing the spread at the median of one tick costs $12.50, leaving −0.6646 ticks before anything else is charged.
Is five-level imbalance better than top-of-book imbalance?
No, it is worse at every horizon we measured. Five-level imbalance correlates 0.0604 with the next second against 0.1433 for the top of book, and 0.0191 against 0.0398 at thirty seconds. Depth behind the best price is mostly cancellable intent.
How wide is the ES order book in practice?
One tick wide on 80.95% of the snapshots in this recording, with a median spread of exactly one tick. The mean spread is 1.542 ticks, or $19.28 to cross, and the gap between that mean and the one-tick median is a tail rather than a session: 4.81% of snapshots are four ticks or wider.
How long does the order-book signal last?
Seconds. The correlation falls from 0.1433 at one second to 0.0876 at five and 0.0398 at thirty, which is the decay profile of information held in the front of the queue and consumed by the next few trades.