The ES Book Is One Tick Wide 80.95% of the Time
Across 20,230,919 top-of-book snapshots from our own ES level-2 recording, the spread is one tick on 80.95% of them, two or more on 19.05%, and four or more on 4.81%. The median is exactly one tick and the mean is 1.542, which is $19.28 against the $25.00 of slippage this series charges on every trade. The exceptions follow the clock: 09:30 New York is one tick wide on 92.50% of snapshots with 49 contracts resting, while the 17:00 half-hour around the daily maintenance halt manages 3.20% with 4.
Across 20,230,919 top-of-book snapshots from our own ES level-2 recording, the spread is one tick on 80.95% of them. The median spread is exactly one tick, the mean is 1.542, and both of those are true at the same time. The other 19.05% is not scattered at random. It sits at fixed clock times, and in the 17:00 New York half-hour the book is one tick wide on 3.20% of its snapshots.
This matters to us specifically. Every backtest in this series charges two ticks of slippage on every round trip, and until we ran this we had never checked that number against the book it is supposed to represent.
What this sample is, and what it is not
The rest of this series runs on an ES tick archive that starts in 2014. The depth recording does not. It is 76 trading sessions, June to September 2026, because that is when we started keeping full level-2 state rather than prints.
So this is a picture of the current book and nothing more. It says nothing about whether the ES spread was wider in 2014, and no claim below should be read as a trend. Three months of depth is enough to describe a daily rhythm that repeats 76 times. It is not enough to describe a decade.
What we got wrong, twice
This is the article in the series that audits our own assumptions, so it gets to audit two of its own.
The clock. The first version of this test bucketed the clock with a fixed UTC-4 offset and a modulo, which produced negative buckets and ignored daylight saving entirely. The published version converts each microsecond epoch to a real New York timestamp before bucketing.
The weekends. The second version still counted the weekend partitions. Our recorder does not stop when the market does: it keeps writing a frozen book, 24 hours parked at a single mid, and six of the 82 date partitions in the store are exactly that. A frozen book is not a market and a quote that never moves is not a price anyone could trade against, so those six are now dropped and the sample is 76 sessions.
That correction is not cosmetic. It moved the headline of this article by seven percentage points: the share of snapshots one tick wide went from 73.6% to 80.95%, and the mean spread fell from 1.929 ticks to 1.542. Every figure below comes from the third pass, and the earlier ones are wrong rather than merely imprecise. We are stating the size of the error because a measurement we quote in thirty other articles should not change quietly.
The rule
No trades are simulated here. It is a measurement of the resting book.
- ES front month, top of book only, from our own level-2 recording. Best bid and best ask as they stood at each snapshot.
- Spread is the best ask minus the best bid, in ticks. One ES tick is 0.25 index points and $12.50.
- Size at the touch is the resting quantity at the best bid and the best ask. Size across five levels aggregates the first five price levels on both sides.
- Every snapshot is assigned to a half-hour of New York time, with daylight saving handled by the timestamp conversion rather than by an offset.
- Weekend partitions where the book sits frozen at a single price are excluded before anything is counted.
- Medians for size, means for spread, and both reported side by side wherever they disagree.
The distribution
| Measure | Value |
|---|---|
| Snapshots | 20,230,919 |
| Median spread | 1.0 tick |
| Mean spread | 1.542 ticks |
| One tick wide | 80.95% |
| Two ticks or more | 19.05% |
| Four ticks or more | 4.81% |
| 99th percentile spread | 14.0 ticks |
| Widest single snapshot | 399.0 ticks |
| Median size at the touch | 24 contracts |
| 10th percentile size at the touch | 9 contracts |
| 90th percentile size at the touch | 69 contracts |
The mean and the median tell different stories here and neither one is wrong. The median says what you will see if you glance at the book: one tick, four times out of five. The mean says what you will pay if you keep trading it, and it sits half a tick above the median because the tail is long, not because the typical spread is wide.
The widest single snapshot in the sample is 399.0 ticks, which is roughly a hundred index points of air between the two sides. That one print contributes almost nothing to a mean built from 20.2 million observations. It is in the table because it is the shape of the risk, not the size of it.
Depth behaves the same way. A median of 24 contracts at the touch sounds comfortable until you notice that the 10th percentile is 9. One snapshot in ten has single-digit size at the best bid and ask.
The clock, all 48 rows
This is a reference table rather than an argument, so here is all of it. Sort your own strategy’s trading hours against it.
| Half-hour | Snapshots | Mean spread (ticks) | One tick wide | Four ticks or more | Median size at touch | Median size, 5 levels |
|---|---|---|---|---|---|---|
| 00:00 | 398,872 | 1.650 | 76.49% | 5.42% | 17 | 158 |
| 00:30 | 383,158 | 1.671 | 76.09% | 5.64% | 17 | 158 |
| 01:00 | 398,711 | 1.653 | 76.24% | 5.42% | 17 | 159 |
| 01:30 | 398,825 | 1.649 | 76.66% | 5.42% | 17 | 158 |
| 02:00 | 408,272 | 1.601 | 80.49% | 5.29% | 18 | 167 |
| 02:30 | 390,306 | 1.636 | 78.87% | 5.54% | 18 | 162 |
| 03:00 | 416,923 | 1.604 | 79.32% | 5.18% | 20 | 180 |
| 03:30 | 381,115 | 1.476 | 81.79% | 3.84% | 20 | 181 |
| 04:00 | 406,628 | 1.138 | 86.36% | 0.01% | 19 | 180 |
| 04:30 | 352,309 | 1.127 | 87.31% | 0.00% | 20 | 184 |
| 05:00 | 359,775 | 1.128 | 87.22% | 0.00% | 21 | 187 |
| 05:30 | 356,238 | 1.116 | 88.43% | 0.00% | 22 | 184 |
| 06:00 | 357,597 | 1.116 | 88.38% | 0.00% | 22 | 188 |
| 06:30 | 351,723 | 1.118 | 88.22% | 0.00% | 22 | 186 |
| 07:00 | 368,162 | 1.124 | 87.66% | 0.00% | 21 | 187 |
| 07:30 | 365,169 | 1.111 | 88.90% | 0.00% | 21 | 189 |
| 08:00 | 408,129 | 1.557 | 81.81% | 5.29% | 22 | 197 |
| 08:30 | 415,392 | 1.561 | 80.87% | 5.14% | 23 | 207 |
| 09:00 | 415,769 | 1.448 | 87.81% | 4.74% | 29 | 259 |
| 09:30 | 1,085,555 | 1.222 | 92.50% | 2.01% | 49 | 449 |
| 10:00 | 763,814 | 1.290 | 91.72% | 2.80% | 52 | 479 |
| 10:30 | 559,955 | 1.397 | 89.48% | 3.72% | 53 | 484 |
| 11:00 | 419,110 | 1.530 | 86.55% | 5.16% | 43 | 384 |
| 11:30 | 425,466 | 1.517 | 87.20% | 5.08% | 45 | 394 |
| 12:00 | 564,026 | 1.389 | 90.33% | 3.83% | 56 | 520 |
| 12:30 | 442,992 | 1.495 | 87.92% | 4.88% | 48 | 421 |
| 13:00 | 433,337 | 1.600 | 86.33% | 6.85% | 50 | 419 |
| 13:30 | 424,620 | 1.593 | 86.80% | 6.61% | 52 | 452 |
| 14:00 | 431,872 | 1.597 | 86.53% | 6.92% | 51 | 439 |
| 14:30 | 433,797 | 1.597 | 86.53% | 7.04% | 54 | 467 |
| 15:00 | 426,205 | 1.578 | 87.41% | 6.13% | 57 | 492 |
| 15:30 | 496,983 | 1.460 | 88.84% | 5.09% | 74 | 753 |
| 16:00 | 445,371 | 1.599 | 83.57% | 6.42% | 43 | 339 |
| 16:30 | 362,355 | 1.739 | 81.16% | 8.37% | 31 | 243 |
| 17:00 | 225,435 | 3.813 | 3.20% | 27.70% | 4 | 43 |
| 17:30 | 148,190 | 3.896 | 6.25% | 29.58% | 4 | 42 |
| 18:00 | 348,848 | 1.936 | 55.41% | 6.49% | 12 | 106 |
| 18:30 | 320,355 | 1.882 | 62.26% | 6.11% | 14 | 129 |
| 19:00 | 342,954 | 1.864 | 63.06% | 6.32% | 14 | 131 |
| 19:30 | 375,933 | 1.787 | 65.78% | 5.98% | 15 | 136 |
| 20:00 | 438,038 | 1.662 | 71.58% | 4.93% | 15 | 147 |
| 20:30 | 431,119 | 1.627 | 75.68% | 5.01% | 16 | 150 |
| 21:00 | 446,971 | 1.602 | 76.89% | 4.83% | 16 | 157 |
| 21:30 | 443,007 | 1.603 | 77.05% | 4.88% | 17 | 157 |
| 22:00 | 427,786 | 1.617 | 77.03% | 5.05% | 17 | 158 |
| 22:30 | 416,183 | 1.624 | 77.34% | 5.19% | 17 | 161 |
| 23:00 | 406,447 | 1.621 | 78.64% | 5.31% | 19 | 163 |
| 23:30 | 411,122 | 1.634 | 76.93% | 5.25% | 17 | 158 |
| Three rows carry the story. The tightest half-hour is 09:30, one tick wide on 92.50% of its snapshots with a median of 49 contracts resting. The widest is 17:00, one tick wide on 3.20%, with a mean spread of 3.813 ticks and a median of 4 contracts at the touch. That half-hour is the CME daily maintenance halt and the reopen around it, and it is the single most hostile execution window on the ES clock. The deepest is 15:30, at a median of 74 contracts, as the cash close pulls size back into the book. |
One row is worth reading against the folklore. The quietest hours in the sample, 04:00 through 07:30 New York, are the tightest on the clock, full stop: mean spreads of 1.111 to 1.138 ticks, tighter than the cash open. Four ticks or wider rounds to 0.00% in seven of those eight half-hours. Thin and wide are not the same thing on this instrument. The book thins out overnight in size, from 49 contracts at the open to 21 at 07:30, and stays one tick wide anyway.
The shape of it
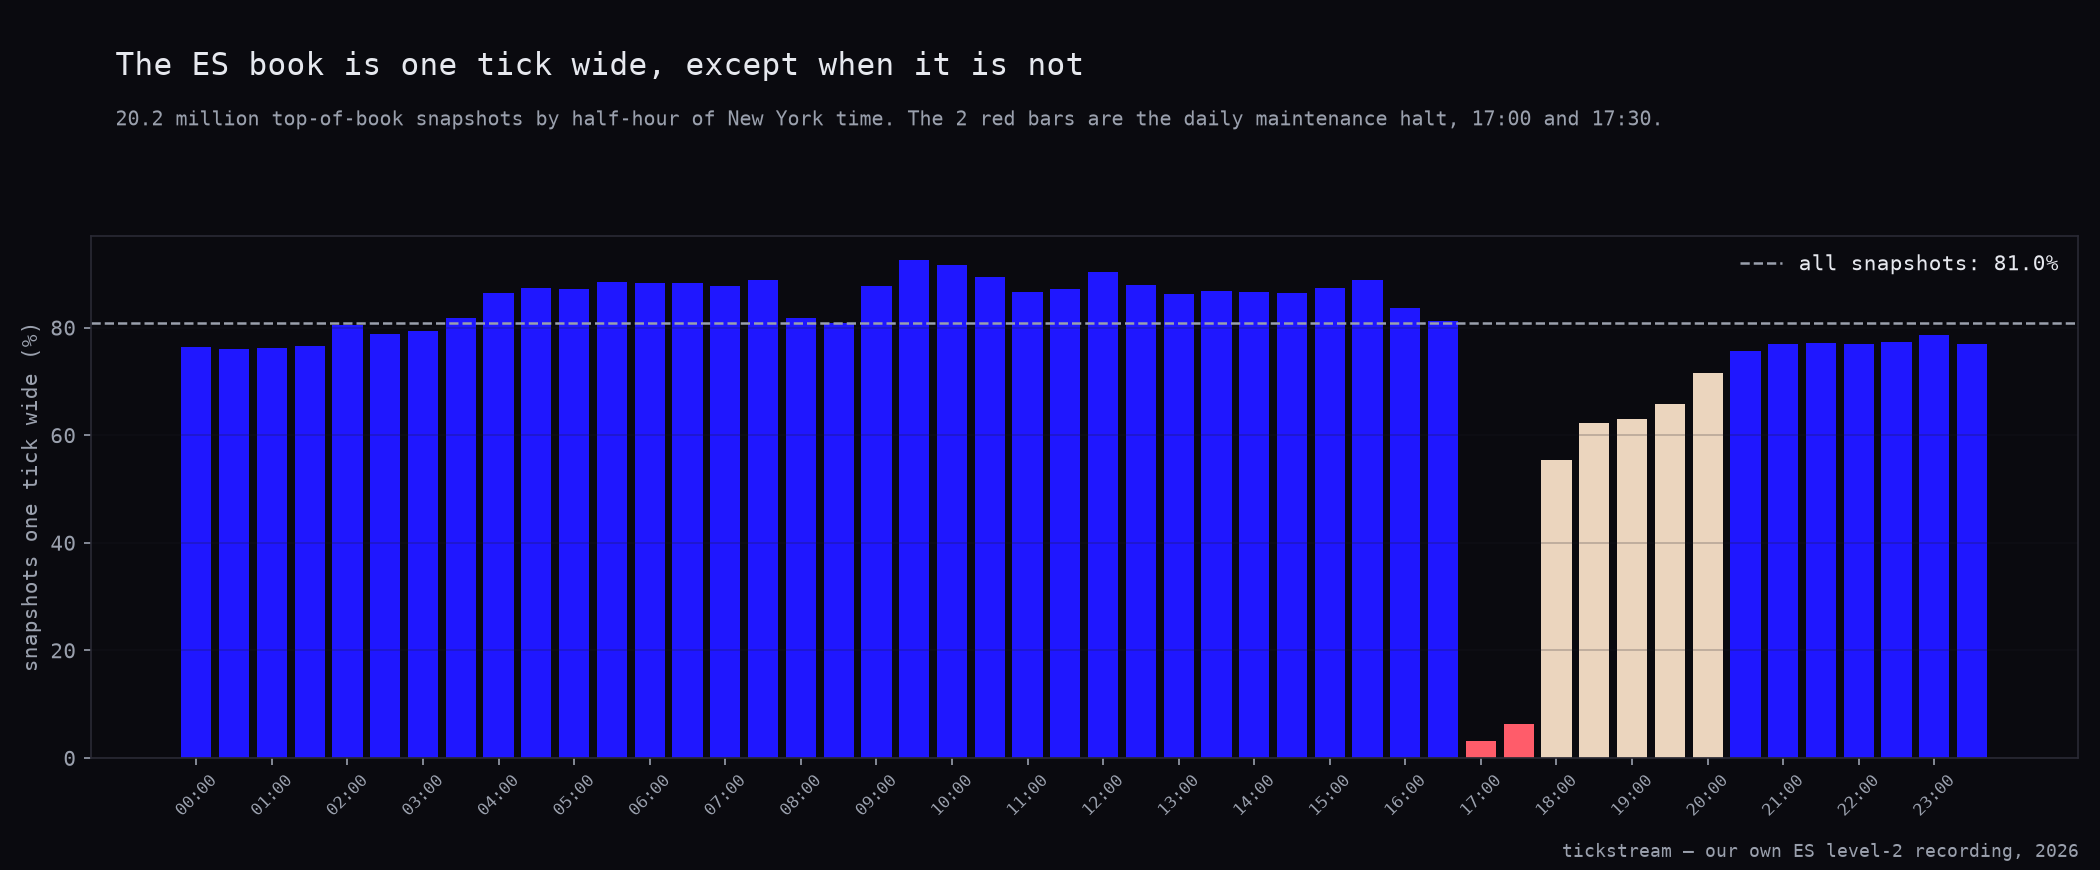
The first chart is the share of snapshots one tick wide, half-hour by half-hour, with the all-snapshot average drawn across as a dashed line at 80.95%. Only two bars fall below half and they are consecutive: 17:00 and 17:30. Every half-hour from 09:00 to 16:00 sits above the dashed line, and so does every half-hour from 03:30 to 08:00.
The second chart puts median size at the touch as bars against mean spread as a line, on the same clock. We titled it “depth and spread are the same picture, upside down”, and the new table says that title is only half earned. It is true at the halt: the bars collapse to 4 contracts at 17:00 exactly as the line spikes to its high. Away from the halt the two series come apart. Depth peaks at 15:30 with 74 contracts and the spread line there reads 1.460 ticks, which is tighter than the 1.542 average but nowhere near the day’s low. The actual low is 1.111 ticks at 07:30, where only 21 contracts are resting. Across the 46 half-hours that are not the halt, depth and mean spread correlate −0.16, which is a hint rather than a mirror.
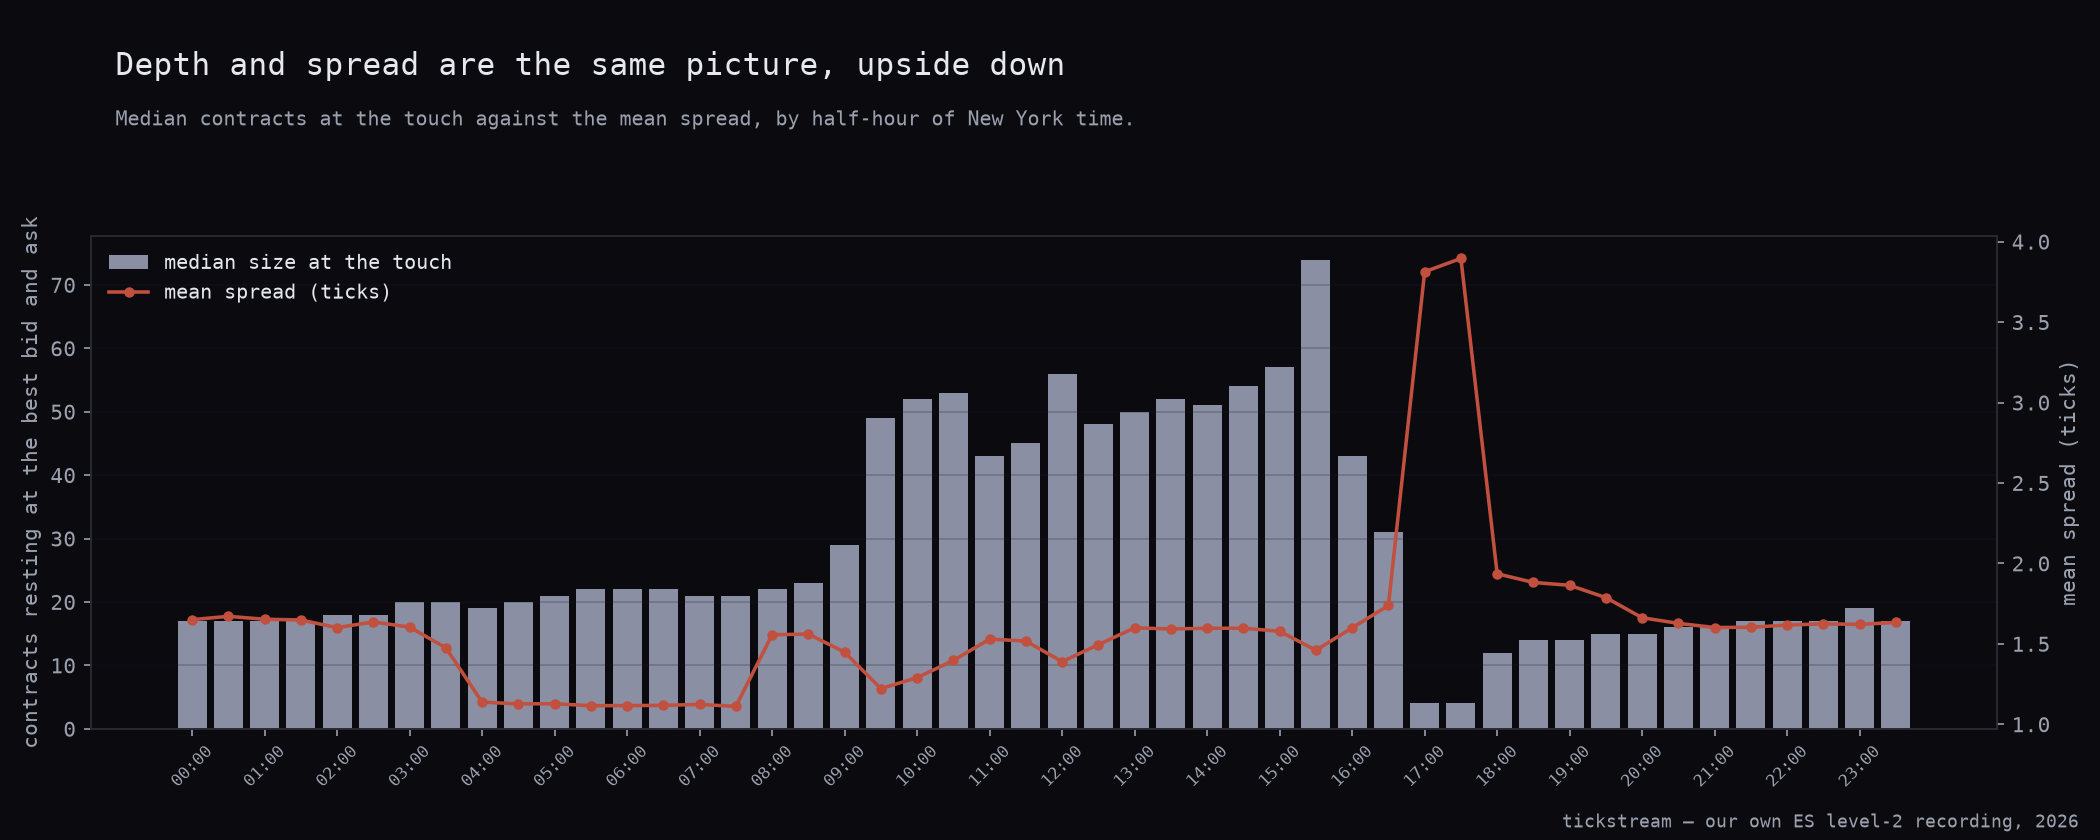
So the honest version is narrower than the chart title. Depth and spread move together when liquidity actually leaves the market, and the halt is the only window in the sample where that happens. The rest of the night is thin but orderly: fewer contracts, same one-tick quote. What survives intact is the practical part — the clock tells you which state you are in before the trade rather than after the fill, which is more than any indicator we have tested in this series manages.
What our cost assumption is worth
Every backtest in this series charges $4.50 of commission plus two ticks of slippage per round trip. Two ticks on ES is $25.00. Here is that number against the book.
| Dollars | |
|---|---|
| Slippage this series assumes | $25.00 |
| Mean spread, all snapshots | $19.28 |
| Mean spread, 17:00 half-hour | $47.66 |
| 99th percentile spread, all snapshots | $175.00 |
The assumption we have been using for thirty-odd articles is not “very slightly conservative”, which is what we said when the frozen weekends were still in the sample and the mean came out at $24.11. It is conservative by $5.72 a round trip against the mean spread of the whole sample, or a little under a quarter of the charge. That is a real cushion, and it was luck rather than judgement: we picked two ticks by convention and never measured it.
The qualifier still stands, and it is the part that matters for the back catalogue. Against the 17:00 half-hour, where the mean spread alone is $47.66, two ticks is not conservative, it is barely half the bill. Against the 99th percentile of $175.00 it is not in the same range.
So here is what that does and does not affect in what we have published.
The cash-session results have more cushion than we thought. Every half-hour from 09:30 to 16:00 has a mean spread at or below 1.600 ticks, from 1.222 at the open to 1.600 in the early afternoon. The intraday clock study, the New York cells of the session audit, and every cash-session rule in this series were charged at least $5 a round trip more than the book asked for. A result that survived those costs survives this table with room to spare.
The Asia and London cells flip from undercharged to overcharged. When the weekends were in, the session audit’s Asia window of 20:00 to 03:00 ran up to 2.093 ticks and we reported undercharging it by about a dollar. On the corrected table that window runs between 1.601 and 1.671 ticks, so its worst half-hour costs $20.89 against the $25.00 we charge. Nothing in the night is undercharged. The London window of 03:00 to 08:00 is cheaper still, bottoming at 1.111 ticks. Our thin-session results were conservative throughout, not marginal, and the earlier version of this article said otherwise.
Nothing we have published trades the 17:00 window. That is luck rather than design. Our overnight drift test enters at the 16:00 cash close, mean spread 1.599 ticks, and exits at the 09:30 open, mean spread 1.222. Both are well inside the assumption, and the test holds through the halt without transacting in it.
The honest summary is that our published results are not wrong because of this, and that they were charged more than the book asked for rather than slightly more. The next strategy we test in the reopen window still needs a different cost line than the one in our template.
What we changed
Nothing came out of the book, because nothing in the book needed to. What changed is the standing of the number. Two ticks was a convention we inherited and now it is a measured figure with a known error, $5.72 on the right side of the mean and badly on the wrong side at 17:00. Any future test that fires in the halt or the reopen gets its cost line from this table rather than from the template. This article is what the rest of the series will point at when it quotes a slippage figure.
The clock is the cheapest cost signal available and it costs nothing to use, because it is on the wall before the trade rather than in the fill afterwards. Working an order at 17:00 instead of 09:30 is a different trade with the same ticket, and the difference is 4 contracts resting instead of 49. If a rule only fires in the thin hours, the spread is not a detail of the backtest, it is the result.
The level-2 recording behind this is part of the historical data packages, alongside the ES tick archive back to 2014.
Related: what SPY options cost to trade, the options counterpart to this measurement; order book imbalance on ES, which runs on the same level-2 recording and the same 76 sessions; and the ES session audit, where the thin-session results came from.
Methodology: ES top of book only, from our own level-2 recording; 76 trading sessions, June to September 2026, 20,230,919 snapshots. Six of the 82 date partitions in the store are weekends where the recorder writes a frozen book at a single price; they are excluded. Snapshots are bucketed into half-hours of New York time, converted from the microsecond epoch so daylight saving is handled; one ES tick is 0.25 index points and $12.50. Spread is best ask minus best bid in ticks; size at the touch is the resting quantity at the best bid and ask, and size across five levels aggregates the first five levels on both sides. Spreads are reported as means and percentile shares, sizes as medians. No trades are simulated here, so no commission is charged; the $25.00 figure is this series’ standing two-tick slippage assumption, quoted for comparison rather than applied.
Frequently asked questions
How often is the ES spread one tick wide?
On 80.95% of 20,230,919 top-of-book snapshots from our own level-2 recording. The median spread is exactly 1.0 tick. Two ticks or more shows up on 19.05% of snapshots and four or more on 4.81%, which is why the mean lands at 1.542 ticks rather than at one.
What time of day is the S&P futures book tightest?
The 09:30 New York half-hour, one tick wide on 92.50% of its snapshots with a median of 49 contracts resting at the touch. It is also the busiest half-hour in the sample at 1,085,555 snapshots. The 10:00 half-hour is close behind at 91.72%.
Why does the ES spread blow out at 17:00 New York?
That half-hour contains the CME daily maintenance halt and the reopen around it. The book is one tick wide on 3.20% of its snapshots, the mean spread is 3.813 ticks, and the median size at the touch falls to 4 contracts against 49 at the open. The 17:30 half-hour is barely better at 6.25%, and its mean spread of 3.896 ticks is the widest on the clock.
Is a two-tick slippage assumption enough for ES backtests?
On average it is generous. Two ticks is $25.00 and the mean spread across all 20.2 million snapshots is $19.28, so the assumption overcharges by $5.72 a round trip. It is still not enough in the thin windows: the 17:00 half-hour averages $47.66 of spread alone, and the 99th percentile across the whole sample is $175.00.
How deep is the ES book at the best bid and ask?
Median 24 contracts across the full sample, with a 10th percentile of 9 and a 90th of 69. The deepest half-hour is 15:30 at a median of 74 contracts, and the thinnest are 17:00 and 17:30, both at 4.