Overfitting a Trading Algorithm: Plateaus, Not Peaks
How to tell a robust trading algorithm from a curve-fit one: parameter heatmaps, plateaus vs spikes, fewer knobs, and the drop-the-best-trades test.
Part 14 of 20 · How to Algo · Previous: Walk-forward and out-of-sample · Next: Regime stability
A parameter search always has a winner. The question is whether the winner is a property of the market or a property of the sample. You cannot answer that by looking at the winner. You answer it by looking at its neighbours.
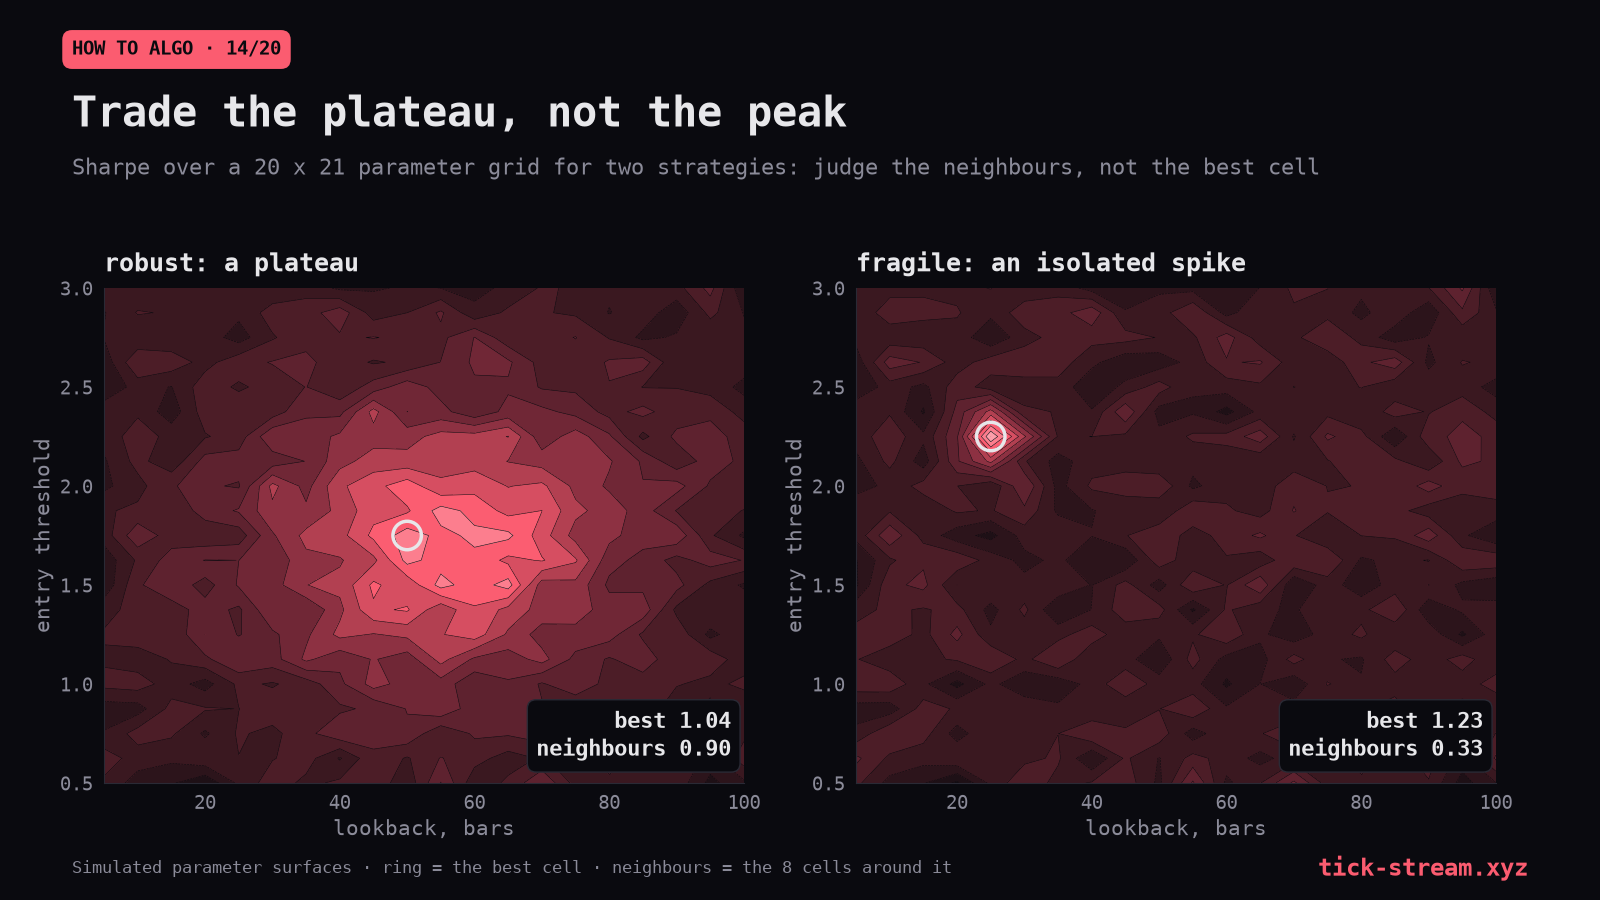
A real effect produces a plateau: a region of parameter space where results are similar, so that small changes in a threshold or a lookback barely matter. Noise produces peaks: isolated cells much better than everything around them. Trade the plateau. Distrust the peak, even if it is the best number you have. In the simulated grids above, the spike has the higher best cell, a Sharpe of 1.23 against 1.04, but its eight neighbours average 0.33; the plateau’s average 0.90.
Read the whole grid
Every parameter search should end with the full grid on screen, not a single best row. Three numbers summarise it:
- The share of positive cells. A real effect makes most cells positive. Noise makes about half.
- The median cell next to the best. A large gap means the best is selection.
- The neighbourhood of the best. Average the best cell with its immediate neighbours; if that average is much worse, the best is a peak.
Our results across very different strategies:
| Test | Grid | Positive cells | Verdict |
|---|---|---|---|
| ES RSI-2 dip buying | 5 thresholds × 4 holds | 20 of 20, in both halves | plateau |
| NQ cash-flow momentum | 144 combinations | 23 of 144 | best at the noise floor |
| NQ Asian-session sweep | 2,392 valid of 3,000 | 40.5% | below a coin flip |
The cash-flow momentum test is typical of what a fitted idea looks like: 121 of 144 combinations lost money, and the best sat exactly where the noise of its own search would put it. The Asian sweep had fewer positive cells than a coin would produce, and its best t of +2.29 was reached by 18% of null searches.
The ES RSI-2 grid is the reference for what robustness looks like: all twenty cells positive in both halves of the sample. Even then, the best cell had to be compared with the best cell of the same grid on shuffled data, because twenty cells on an index that rises produce big numbers by themselves (Part 11).
Robust parameters should not matter much
A useful mindset: if your strategy is real, its parameters should be boring. The lookback should work at 15 and at 25. The threshold should work at 1.5 and at 2.0. A stop of 1 ATR and 1.2 ATR should give similar results.
When one parameter decides the sign, that parameter is carrying the noise. In our rebuild of an NQ VWAP drift strategy, the author’s trade caps (a maximum number of trades and losses per day) were presented as essential guardrails. We tested them properly, as a 2×2 against a trigger timeframe the author never specified. With a 5-minute trigger, the caps cost $22k; with a 15-minute trigger, they added $14.7k. A rule whose effect changes sign depending on a parameter nobody specified is not doing work. It is smoothing noise.
Degrees of freedom against trades
Every tunable parameter is a degree of freedom that the data has to pin down, and every rule you add multiplies the variants you implicitly tested. A crude but useful way to think about it:
- each parameter you optimise should be supported by hundreds of independent trades, more for intraday strategies with small per-trade Sharpe (Part 10);
- each rule added after looking at the results counts as a new variant, not a refinement;
- each discretionary choice (which session, which years, which instrument) counts too.
A strategy with five optimised parameters, two filters and 300 trades has almost certainly fitted its sample. Most of the strategies we have killed had more knobs than their trade counts could support.
The cleanest strategies we have seen have very few parameters, each set by the mechanism rather than by search. A multi-day dip-buying rule has a lookback, a threshold and a holding period, and each of them can be varied widely without changing the conclusion.
Concentration: remove the best trades
A strategy can have a robust grid and still be fragile if a few trades carry it. The test takes one line: recompute without the top one, three and one percent of trades.
In an internal, unpublished run we tested a complete anchored-VWAP rulebook from a trading book on NQ: six anchor types, two entry methods, twelve combinations. The best had t = +1.33, none exceeded 2, and every single one lost money once its three best trades were removed, from −$12,579 to −$289,857. In one combination a single trade carried 48% of the result and the top three carried 106%. A null run with random anchors found a t of 1.22 at the median, and 43% of null runs reached the real best. The rulebook was a few lucky trades on a rising index.
The test does not condemn the indicator everywhere. On ES, our published anchored-VWAP run passes it: removing each column’s three best trades barely moves the average trade. Run the test per market; it is the strategy on that data that passes or fails.
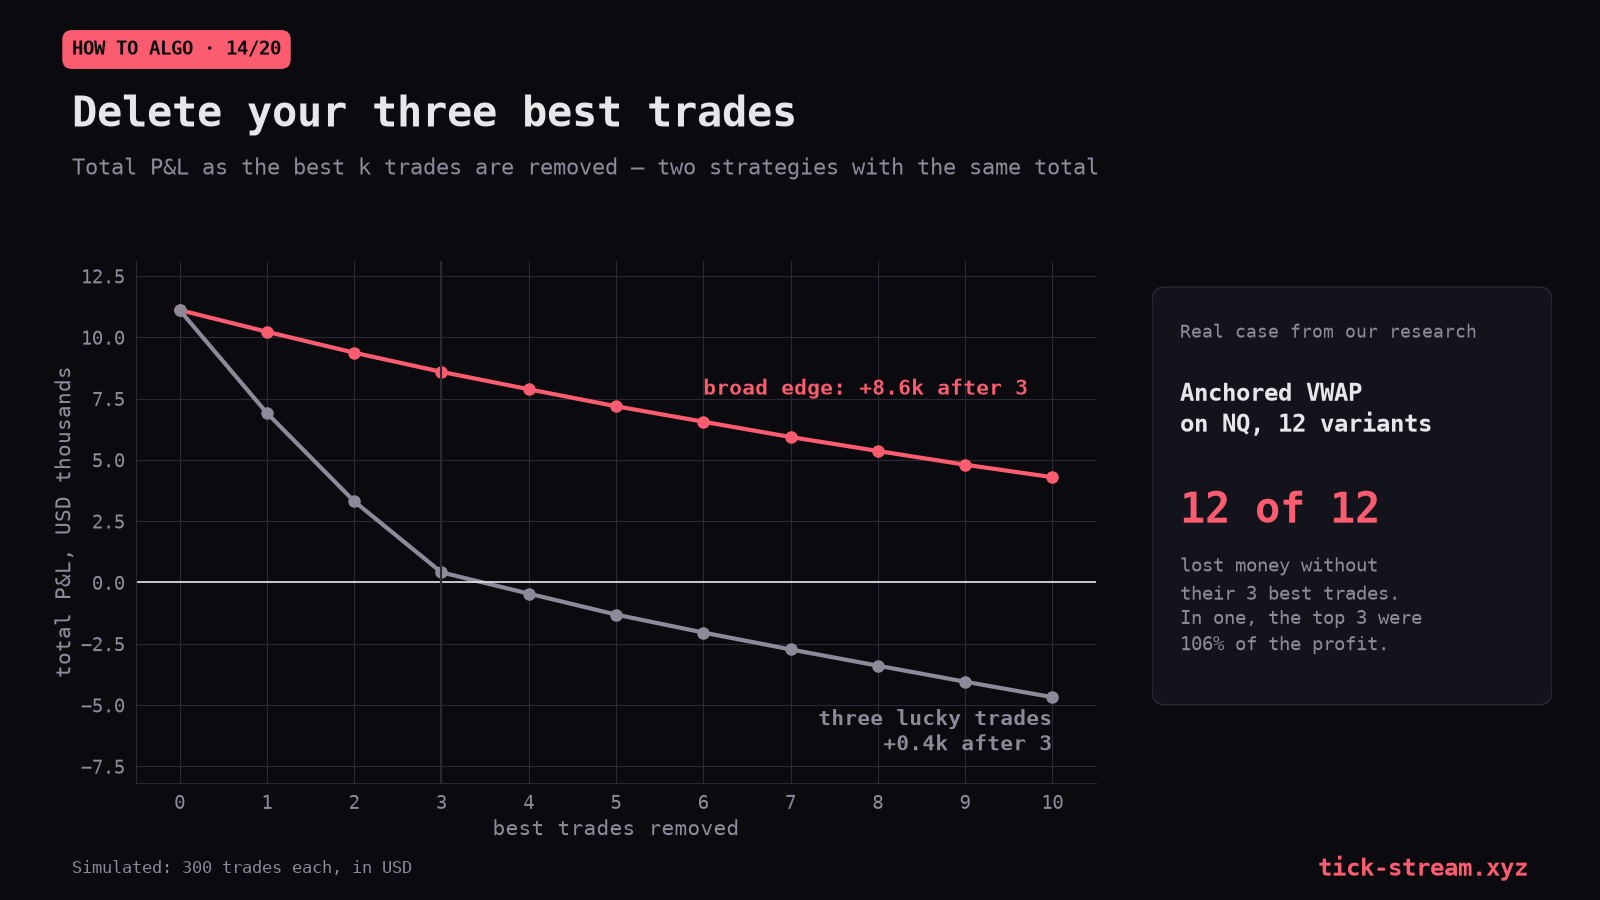
The chart shows the shape to look for, with two simulated strategies that both total about +$11.1k: one built on many small advantages keeps +$8.6k after its three best trades are gone, the other keeps +$0.4k.
Scale-free parameters age better
Parameters in fixed points are fitted to the volatility of the sample. An 80-point stop on NQ in 2019 and in 2026 are different stops, because NQ’s ranges grew with its price. Part 9 shows how that drift killed one strategy’s margin: average losses grew from 58 to 74 points while wins were capped at about 40.
Parameters expressed as a multiple of ATR, a percentage of price or a fraction of a structure’s range keep their meaning as volatility changes. They are not free of fitting, but they do not quietly turn into a different strategy over seven years.
When not to tune at all
The hardest discipline in optimisation is stopping. Our NQ machine-learning candidate had t = +1.42 on 1,500 trades. At that level of evidence, every additional threshold, feature or hyperparameter choice is a fit to noise. We had seen that path before: several of our earlier results, a narrow-range breakout at t ≈ 3.9, a confluence stack at +$505k, a delta-thrust signal at a Sharpe of 3.78, had been tuned into existence and later died. The candidate went to a pre-registered replication instead of an optimiser, and failed it.
If a result needs tuning to look good, the tuning is the result.
A robustness routine
For every candidate, before anything else:
- Plot the full grid and report the share of positive cells and the median.
- Average the best cell with its neighbours.
- Perturb each parameter by ±20% and report the range of results.
- Remove the top 1, 3 and 1% of trades.
- Re-run the grid on each half of the data separately; compare the two heatmaps.
- Re-run the grid on shuffled data and place the real best in that distribution.
- Count the parameters you tuned and the rules you added after looking.
Checklist
- Judge strategies by plateaus, never by the best cell.
- Require most cells of a sensible grid to be positive.
- Prefer few parameters set by the mechanism.
- Express parameters in scale-free units.
- Treat any parameter whose value flips the sign as noise.
- Remove the top trades and check the sign.
- Optimise only inside a walk-forward.
- Stop tuning when the evidence is thin.
A strategy can be robust across parameters and still depend on a single period of market history. Part 15: Regime stability, and the every-year test.
Frequently asked questions
How do you know if a trading strategy is overfitted?
Choosing rules and parameters that fit the noise in historical data rather than a repeatable effect. The symptoms are a best result surrounded by much worse neighbours, performance that depends on a few trades, and parameters that change every time the data window moves. An overfit strategy backtests well and trades like a random one.
What is a parameter plateau?
A region of parameter space where nearby values give similar results, so small changes in a threshold or lookback barely matter. A lucky setting is an isolated peak instead. In our simulated grids, the plateau's best cell had a Sharpe of 1.04 with neighbours averaging 0.90, while the spike's best of 1.23 had neighbours at 0.33.
How many parameters can a strategy have?
There is no fixed rule, but each free parameter needs many independent trades to pin down, and every extra rule multiplies the number of variants you implicitly tested. A strategy with five tuned parameters and 200 trades is almost certainly fitted. Fewer knobs, set by the mechanism rather than by optimisation, is the safer design.
What is the remove-the-best-trades test?
Recompute the result without the top one, three, or one percent of trades. A real edge built on many small advantages barely moves. In our internal test of a full anchored-VWAP rulebook on NQ, all twelve combinations lost money once their three best trades were removed, and in one of them a single trade carried 48% of the result. Our published ES anchored-VWAP run did not show this.
Should I optimise parameters at all?
Optimise as little as possible, and only inside a walk-forward so the optimisation itself is tested out of sample. Prefer parameters that scale with the market, such as multiples of ATR or percentages, over fixed points. When the evidence is thin, do not tune: at t = 1.4 every threshold or feature choice is a fit to noise.