Break-Even Win Rate: Why 80% Winners Can Still Lose
The break-even win rate formula with costs included, expectancy and profit factor, and why 77% to 91% win-rate setups still lose money on futures.
Part 9 of 20 · How to Algo · Previous: Trading costs · Next: How many trades you need
A win rate is a property of the exit, not of the signal. Move the target closer and the win rate goes up. Move it further away and the win rate goes down. Neither move tells you whether the strategy makes money. That is decided by expectancy: the average result per trade after costs.
If you remember one formula from this series, make it this one:
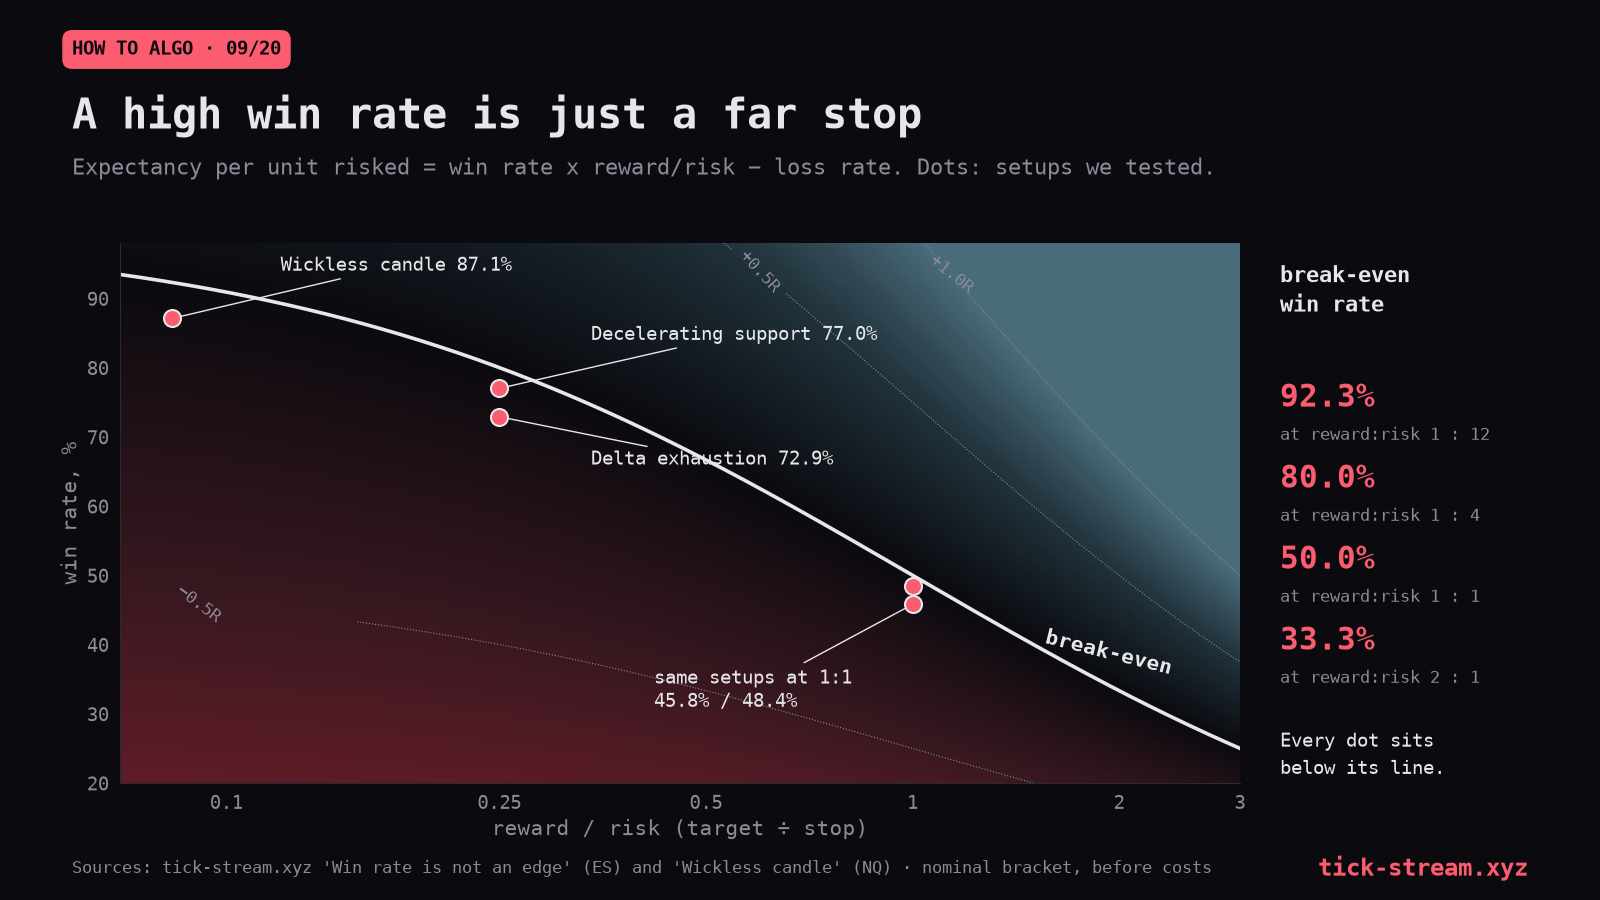
break-even win rate = (stop + costs) / (target + stop)
Every claimed win rate can be checked against it in your head, without a backtest.
The definitions
With a win rate p, an average win W, an average loss L and round-trip costs c:
- Expectancy = p·W − (1 − p)·L − c. The average net result per trade.
- Payoff ratio = W / L. How large wins are relative to losses.
- Profit factor = total net profit of winners divided by total net loss of losers. Above 1 is profitable.
- Break-even win rate = (L + c) / (W + L). The win rate at which expectancy is exactly zero.
Without costs the break-even rate is simply the stop’s share of the total bracket:
| Target : stop | Break-even win rate before costs |
|---|---|
| 1 : 4 | 80.0% |
| 1 : 2 | 66.7% |
| 1 : 1 | 50.0% |
| 2 : 1 | 33.3% |
| 3 : 1 | 25.0% |
| 1 : 8 | 88.9% |
| 1 : 12 | 92.3% |
Costs push every row up. The tighter the bracket in ticks, the more they push.
Three strategies that win often and lose money
A 77% win rate losing $71 a trade. On ES five-minute bars, a popular decelerating-support setup traded with its taught bracket, a 0.5-ATR target against a 2-ATR stop, won 77.0% of its trades. The bracket pays one unit for every four risked, so it needs 80% to break even before costs. It lost $71.14 a trade. We re-scored the same signals with a symmetric bracket: the win rate fell to 45.8% and the expectancy moved to −$72.42, a change of $1.28 on a 31-point swing in win rate. Delta exhaustion did the same: 72.9% wins at its taught bracket and 48.4% at 1:1, losing $29.30 and $31.79 a trade. The three-setup study has the full table.
91.1% of trades reached their target. The viral wickless candle retest on ES, with a 0.25-ATR take-profit and a 3-ATR stop, hit its target on 91.1% of trades. After $29.50 of round-trip costs, only 16.5% of trades were net winners, because a quarter of an ATR on five-minute bars is often worth less than the round trip. The strategy lost $2,212,763. Wickless candles on ES. Target-hit rate and win rate stop being the same number once costs come out.
86% wins, 89.3% needed. A prop-firm VWAP strategy a reader sent us took $250 and risked $2,000. It won 86% of the time. Its break-even, with costs, was 89.3%. We tested 24 signal variants and 36 bracket combinations hunting the missing 3.4 points and every one fell short by about the same amount; a random entry beat it in 17 of 20 runs.
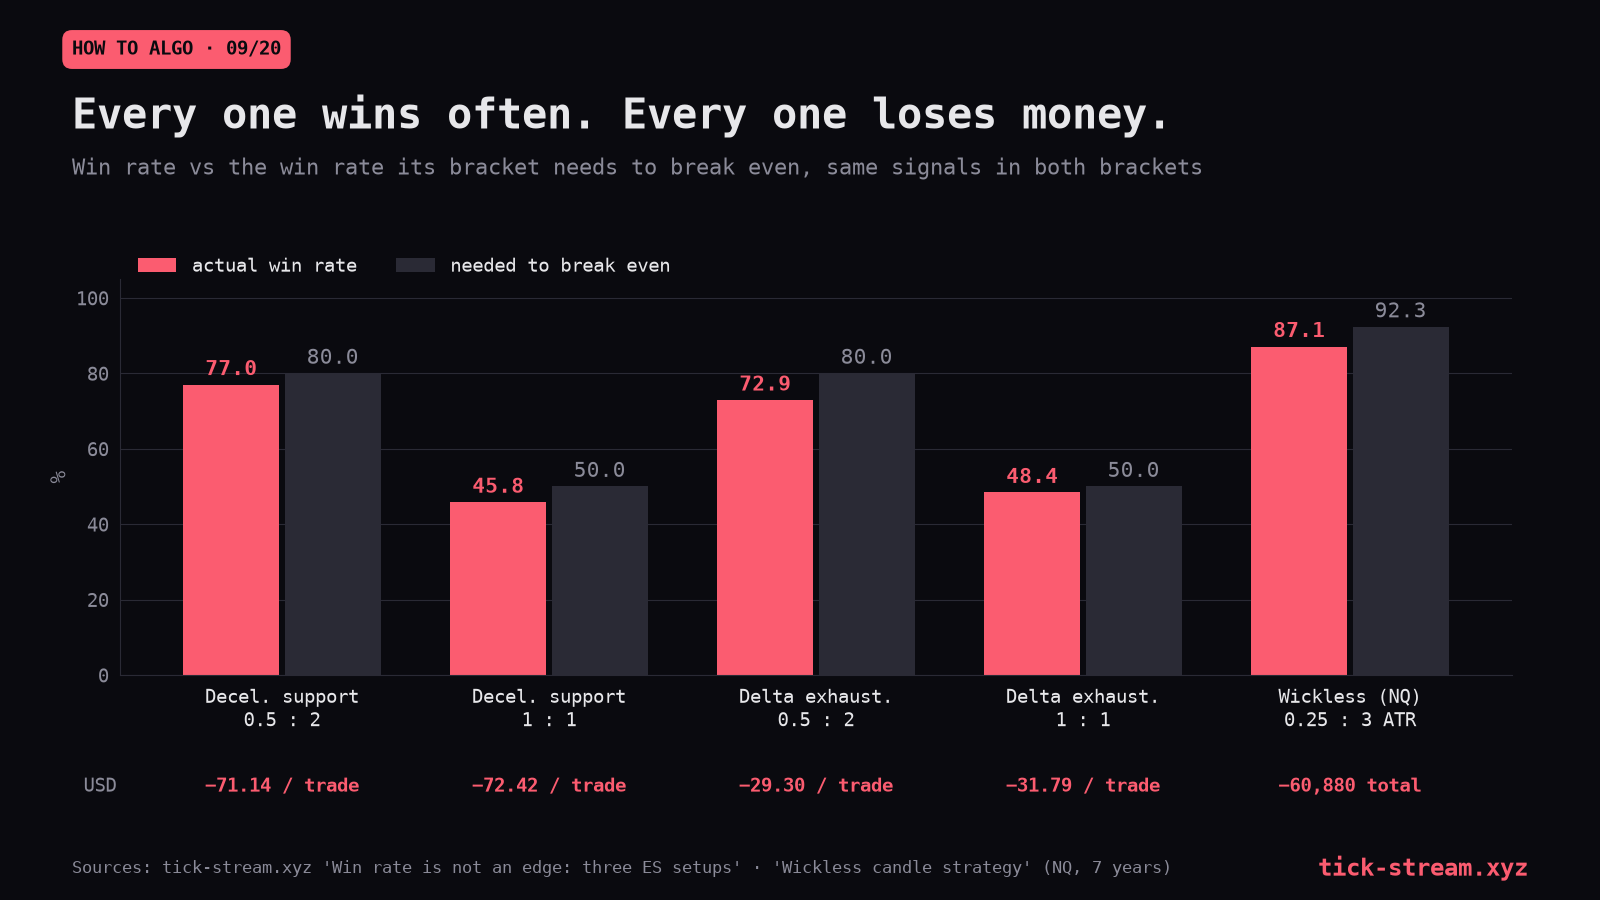
Every one wins often and every one sits below its break-even. The NQ wickless candle, a 0.25-ATR target against a 3-ATR stop, won 87.1% against the 92.3% it needed and lost $60,880.
The reverse trap: a stop that manufactures a terrible win rate
Win rates can be manufactured downward too. In our test of an Asian-session sweep reversal on NQ, an early version placed the stop two ticks behind the extreme of a one-minute bar. That is practically at the entry, and the win rate was 5.6%. It looked like a dead idea; it was a dead stop. Parameterising the stop as a fraction of the range and reporting the whole grid fixed the measurement (the idea died anyway, for other reasons covered in Part 11).
The lesson cuts both ways: before you conclude anything about a signal from its win rate, look at the bracket.
Fixed points and drifting break-even
Brackets set in fixed points create a subtler problem over long backtests: the break-even rate moves with volatility.
We rebuilt a fully specified NQ VWAP drift strategy from an interview. Its target was capped at 40–50 points; its stop was 80 points, with a time stop that usually cut losses earlier. Over the years NQ’s ranges grew. The average win could not grow because the target was capped, so it stayed around 40 points. The average loss grew from about 58 points in 2020 to 74 in 2026. The break-even win rate therefore rose from 58.8% to 63.2%, while the actual win rate stayed around 61%. The margin above break-even shrank every year and went negative. In-sample, 2020 to 2023, the strategy made +$111,720; from 2024 to August 2026 it made −$16,960. The Conti drift test shows the yearly breakdown.
The general rule: any bracket with a wider stop than target, set in fixed points, has a break-even rate that drifts with volatility. Brackets in ATR or percent keep the ratio constant.
Tightening the target always trades expectancy for win rate
In our corrected ES trend-pullback test, tightening the target from 2 ATR to 1 ATR raised the win rate to 48.6%, the best in the variant table, and lost more per trade, −$26.84 against −$23.88. The variant table shows the rest. In our tests, tightening a target has bought win rate at the price of expectancy every time we checked. If it ever seems to rescue a losing signal, check the same-bar rules from Part 5, because close targets are where intrabar fill optimism lives.
Expectancy is an average, so check what carries it
A positive expectancy can come from many small edges or from a few large trades. The second kind is fragile. In a test of a full anchored-VWAP rulebook on NQ, every one of twelve combinations lost money once its three best trades were removed. In one of them, a single trade carried 48% of the result and the top three carried 106%.
Two cheap checks for every result:
- Remove the top N trades (we use 1, 3 and 1% of trades) and recompute. If the sign flips, the expectancy is a few lucky days.
- Look at the median trade next to the mean. A positive mean with a clearly negative median is a lottery profile. It may still be real, but it needs far more trades to prove (see Part 10).
How to read someone else’s claim
When a strategy is advertised with a win rate, you can test it in thirty seconds:
- Find the target and the stop, in the same unit.
- Compute stop / (target + stop). On random ES entries, widening the stop alone moves the win rate while all 64 brackets lose.
- Add costs: two ticks plus commission, divided by (target + stop).
- Compare with the claimed win rate.
If the bracket is not stated, the win rate is not a claim, because it can be set to any value by moving the exits.
Checklist
- Report win rate, average win, average loss, expectancy and profit factor together, after costs.
- Compute the break-even win rate for every bracket you test.
- Score each signal with a symmetric bracket as a control; if expectancy barely moves, the win rate was the exit.
- Use volatility-scaled brackets for multi-year tests, or check that the break-even rate is stable by year.
- Parameterise stops relative to the structure they protect; report the whole grid.
- Remove the top trades and recompute.
- Compare mean and median trade.
- Never compare strategies by win rate alone.
Expectancy tells you whether the average trade is positive. Whether you have enough trades to believe that average is a separate question. Part 10: How many trades you need, statistical significance and the t-stat.
Frequently asked questions
What is the break-even win rate formula?
With a stop of L, a target of W and round-trip costs of c, all in the same unit, the break-even win rate is (L + c) / (W + L). Without costs it reduces to L / (W + L): a 1:1 bracket needs 50%, a 2:1 target needs 33.3%, and a target of a quarter of the stop needs 80%.
What win rate do you need with a 1:2 risk-reward ratio?
Risking one unit to make two needs 33.3% wins before costs, because the stop is one third of the whole bracket. The reverse, risking two to make one, needs 66.7%. Costs push both numbers up, and the tighter the bracket in ticks, the more they push.
How do you calculate trading expectancy?
Expectancy is win rate times average win, minus loss rate times average loss, minus costs: the average net result per trade. It is the number that decides whether a strategy makes money. A win rate alone does not, because it can be raised or lowered at will by moving the target and stop.
Can a strategy with a high win rate lose money?
Easily. Our ES test of decelerating support won 77.0% of trades and lost $71.14 a trade, because its 0.5-ATR target against a 2-ATR stop needs 80% wins to break even before costs. A prop-firm VWAP strategy won 86% of the time against a break-even of 89.3% with costs.
Is profit factor better than win rate?
It is more informative, because it weighs wins and losses by size: gross profit divided by gross loss, after costs, with anything above 1 making money. How far above 1 matters less than whether it is stable across years and robust to extra slippage. A profit factor computed before costs, or on a handful of trades, says very little.