Volatility-Targeted Position Sizing for Futures
Why one fixed contract over seven years distorts a backtest, how volatility targeting normalises risk across ES, NQ and gold, and where micros help sizing.
Part 17 of 20 · How to Algo · Previous: Why filters make strategies worse · Next: Combining strategies
A strategy’s edge decides whether it makes money on average. Its sizing decides whether you are still trading it when the average arrives. Many real edges have been lost not because the signal stopped working but because the position was too large for the worst stretch, and the trader stopped at the bottom.
This part covers sizing as part of algorithm design: risk per trade, contract granularity, volatility normalisation across years and instruments, and the drawdown arithmetic that should set all of them.
Size from the worst trade, not from margin
Exchange and broker margin tells you the minimum capital to hold a position. It says nothing about how much you can lose. Size from the loss side.
The worst trade in our ES RSI-2 test lost $20,967 on one contract; on the micro it was $2,097. The strategy holds through the night with no stop, so the account must be able to absorb that trade without changing its behaviour. That number, not the margin, sets the account size. Holding overnight also means full exchange margin rather than a broker’s day-trading margin, which is another reason to plan from the loss side.
For strategies with stops, the basic formula is:
contracts = floor( risk_budget / (stop_distance_points × point_value) )
| Contract | Point value | One contract with a 10-point stop risks |
|---|---|---|
| ES | $50 | $500 |
| MES | $5 | $50 |
| NQ | $20 | $200 |
| MNQ | $2 | $20 |
With a $250 risk budget per trade, a 10-point ES stop is too large for even one contract; on MES it fits five. Micros turn sizing from a yes/no question into a dial. Their cost is commission: on the micro the commission is a much larger share of a tick (Part 8), so they suit strategies with large edges per trade.
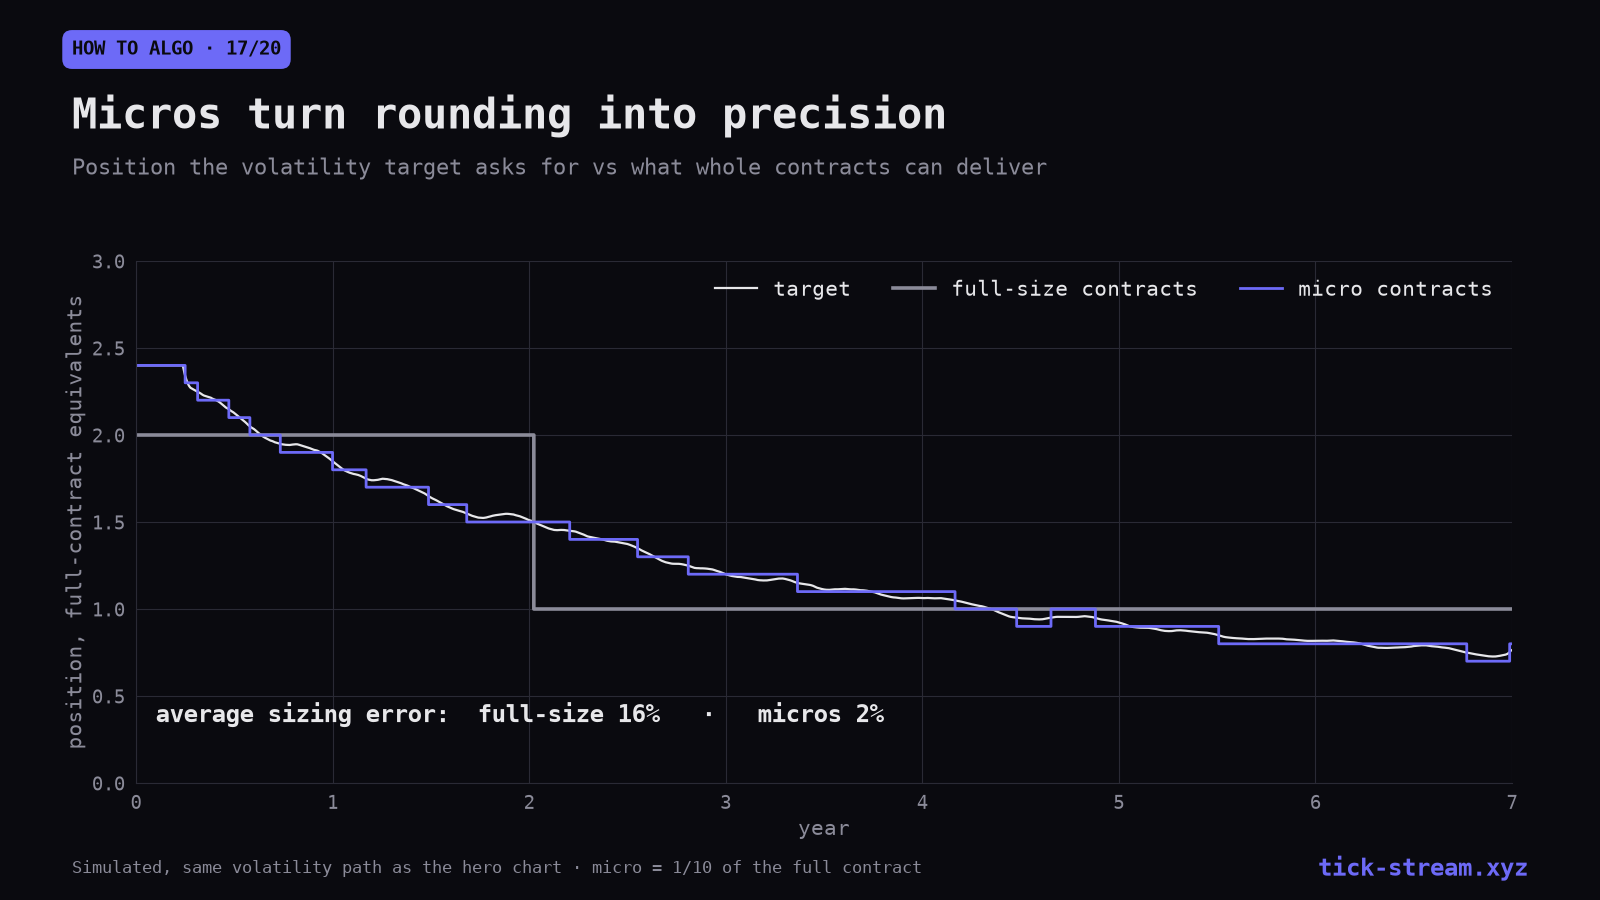
On a simulated volatility path, rounding the target position to full-size contracts missed it by 16% on average; rounding to micros, by 2%.
Two more realities a backtest skips: stops slip, sometimes by many ticks in fast markets, and strategies without stops have a worst case that is only bounded by history. Size for the worst trade in the backtest plus a margin, not exactly for it.
One fixed contract over seven years distorts the backtest
Most published backtests, including ours, report one contract for simplicity. That is fine for asking “is there an edge?” and misleading for asking “what is the risk?”.
A fixed contract carries more dollar risk when the instrument is more volatile. Gold’s price more than tripled from 2019 to 2026 in our data, so the dollar move per contract in the later years was several times that of the early ones. A one-contract backtest on gold is dominated by its last two years; any ATR-based strategy automatically “earns more” in them. When we normalised P&L by a trailing 60-day median dollar range, several gold results that looked positive reversed sign between training and holdout.
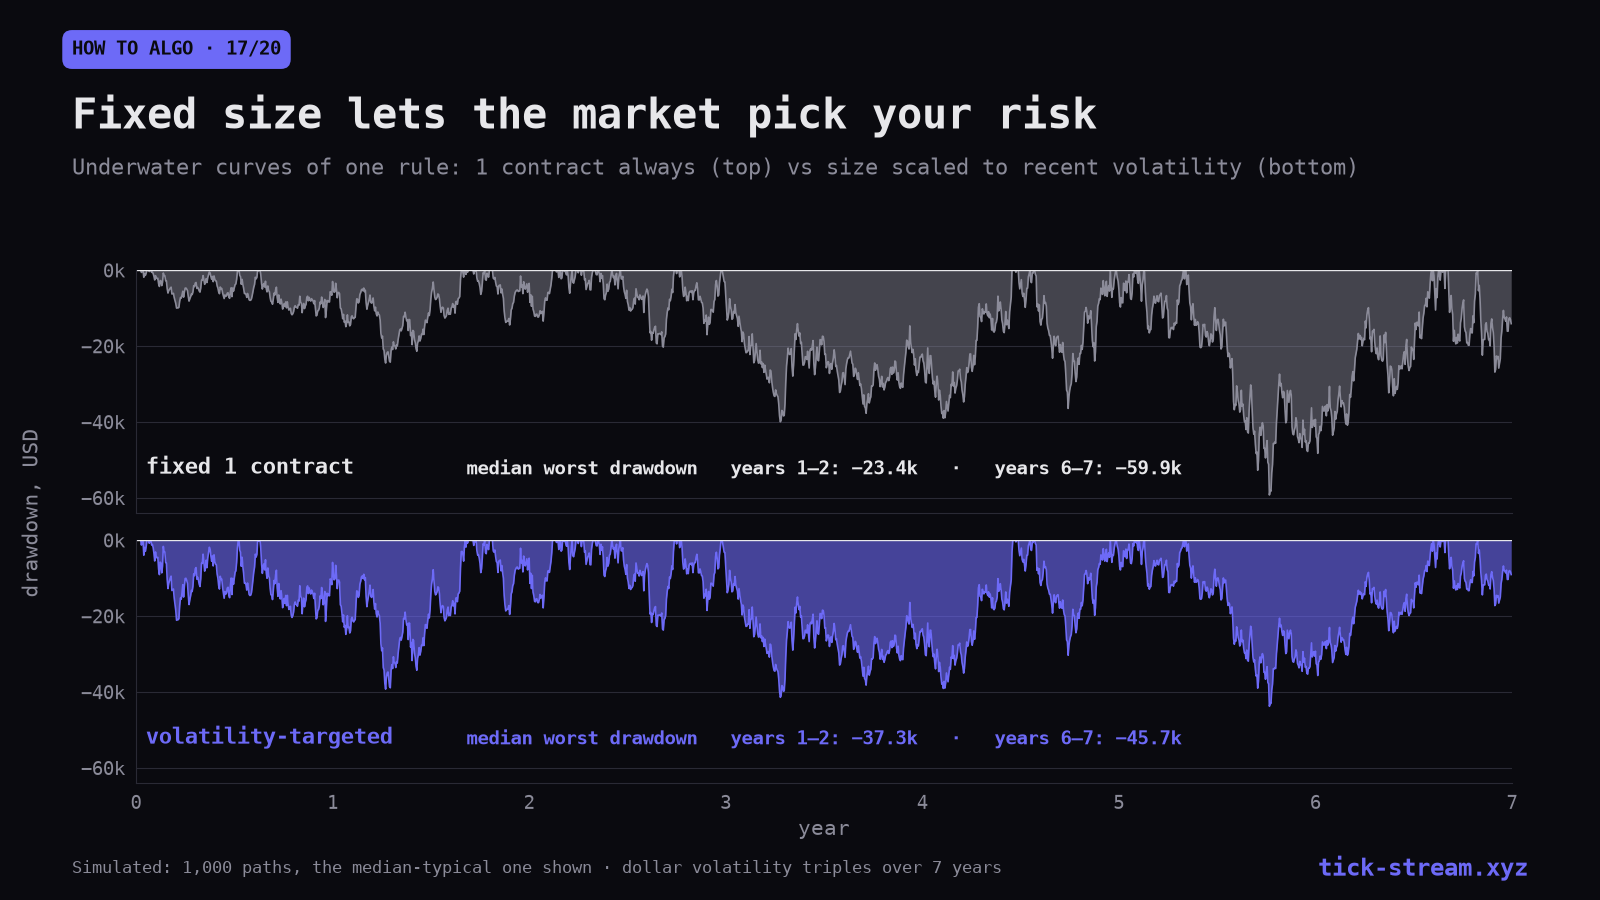
The chart at the top shows the effect in a simulation: an instrument whose dollar volatility triples over seven years, traded with one fixed contract or with a 60-day volatility target at the same average risk. Over 1,000 paths, the median worst drawdown of the fixed contract was 23.4k USD in years 1–2 and 59.9k in years 6–7; the volatility-targeted version stayed between 37.3k and 45.7k. With fixed size, the market picks your risk.
Index futures show the same effect more slowly. NQ’s dollar ranges grew with its price, which is why a fixed-point stop in one strategy we tested produced average losses that grew from 58 to 74 points between 2020 and 2026 (Part 9).
Two consequences for research:
- Judge stability across years on volatility-normalised P&L (Part 15).
- Compute drawdowns on the sizing you will actually use, not on one fixed contract.
Volatility targeting
Volatility targeting sizes each position, or the whole account, to a constant expected dollar volatility:
contracts = target_dollar_vol / (forecast_vol_points × point_value)
The forecast can be a trailing measure such as ATR or realised volatility. Yesterday’s range is a surprisingly good one: on ES it forecast the next session’s range at r = 0.6547, better than dealer gamma’s 0.4195 (gamma and volatility). Implied volatility is another: QQQ at-the-money implied volatility forecast NQ’s next-day absolute move with a rank correlation of about 0.39, against about 0.26 for trailing 20-day realised volatility, in our data.
What volatility targeting does well:
- keeps risk roughly constant through calm and wild years,
- makes instruments with very different volatility comparable in one portfolio,
- reduces the depth of drawdowns that come from volatility spikes.
What it does not do: create an edge. A good volatility forecast is a sizing input, not a direction signal.
A sizing gain that was a method artefact
Our first test of a forward-looking volatility overlay looked excellent: multiplying the finished P&L of a trend strategy by a blend of implied and realised volatility raised its Sharpe from 0.95 to 1.31. It was an artefact. The strategy was already volatility-targeted, sizing at a constant divided by realised volatility. Multiplying its output by another inverse-volatility factor made the effective sizing one over volatility squared, which is simply more aggressive inverse-volatility sizing, not new information.
Done correctly, by substituting the forecast into the strategy’s own sizing denominator, the implied-volatility blend changed the Sharpe from 0.81 to 0.80, cut the maximum drawdown by about 17% and cut the profit by about 16%. Risk-adjusted, it was flat. At the level of a whole book of strategies, no leverage-matched sizer beat constant sizing, because several sleeves already gated themselves on volatility.
The lesson generalises: test sizing changes leverage-matched, comparing Sharpe or return over drawdown at the same average risk. Any scheme that simply increases average exposure will raise returns in a rising market and look like an improvement.
Drawdown arithmetic sets the risk level
Losses and gains are not symmetric. A drawdown of x percent needs a gain of x / (100 − x) to recover:
| Drawdown | Gain needed to recover |
|---|---|
| 10% | 11.1% |
| 20% | 25.0% |
| 33% | 50.0% |
| 50% | 100.0% |
| 75% | 300.0% |
And drawdowns are larger than averages suggest. In a simulation of a strategy with a true Sharpe of 1, the maximum drawdown within a single year had a median of about 0.78 times the annual volatility, and in one year out of twenty it exceeded 1.55 times. (Simulated, normal daily returns; real returns have fatter tails.) A strategy targeting 20% annual volatility should therefore expect a drawdown of over 30% in a bad but ordinary year, before anything goes wrong with the strategy itself.
So the practical sequence is backwards from how most people do it: decide the drawdown you can sit through without changing anything, divide by the drawdown multiple your Sharpe implies, and that gives the volatility target. Part 20 uses the same distribution to set a kill line.
Kelly, briefly
The Kelly criterion gives the size that maximises long-run growth, roughly edge divided by variance. It is exact only if your edge and variance estimates are exact. Backtest estimates are biased upward by selection (Part 11), so full Kelly on a backtest number over-sizes reliably. Treat it as an upper bound and use a fraction, or a volatility target well below it.
Checklist
- Size from the worst historical trade or stop loss, plus a margin, never from margin requirements.
- Use micros when the full contract is too coarse, after checking commission in ticks.
- Round contract counts down.
- Normalise historical P&L by volatility before comparing years or instruments.
- Compute drawdowns on the sizing you will use, not one fixed contract.
- Use volatility targeting to keep risk constant; do not expect it to add edge.
- Test sizing schemes leverage-matched.
- Never multiply an already volatility-targeted series by another volatility scaler.
- Set the volatility target from the drawdown you can tolerate.
- Treat Kelly as an upper bound.
Sizing one strategy well is half the job. The other half is combining several. Part 18: Combining uncorrelated trading strategies into a portfolio.
Frequently asked questions
How do you size positions in futures trading?
Divide the dollar amount you are willing to lose on the trade by the dollar risk of one contract: stop distance in points times the point value. With $250 of risk and a 10-point stop on ES at $50 a point, one contract risks $500, so the trade is too large; on MES at $5 a point, one contract risks $50 and five contracts fit. Round down, never up.
What is volatility targeting?
Sizing positions so that each one, or the whole account, carries a roughly constant expected volatility in dollars: more contracts when markets are calm, fewer when they are wild. In our simulation of an instrument whose dollar volatility triples over seven years, the median worst drawdown of one fixed contract grew from 23.4k USD in years 1–2 to 59.9k in years 6–7, while the volatility-targeted version stayed between 37.3k and 45.7k.
When should I trade micro futures instead of full-size contracts?
When a full contract is too coarse for your risk budget. One ES contract is $50 a point, one MES $5; a strategy whose worst trade on ES was $20,967 had a worst trade of $2,097 on MES. In our simulation, rounding to full-size contracts missed the target position by 16% on average and micros by 2%. Check the commission in ticks first: it is a much larger share of a tick on micros.
Why does a 50% drawdown need a 100% gain to recover?
Because the recovery is computed on a smaller base. A loss of x percent needs a gain of x divided by (100 − x) percent: 10% needs 11.1%, 20% needs 25%, 33% needs 50%, and 50% needs 100%. That asymmetry is why sizing to survive the worst stretch matters more than sizing to maximise the average.
Should I use the Kelly criterion?
Only as an upper bound, and only a fraction of it. Kelly sizing maximises long-run growth if your estimates of edge and variance are exact, and they never are. Backtest estimates are biased upward by selection, so full Kelly on a backtest number reliably over-sizes. Use a fraction, or a volatility target well below it.