Why Filters Usually Make Trading Strategies Worse
Confirmation filters usually lower a strategy's out-of-sample Sharpe: fewer trades, more variance, selection on noise. How to test a filter fairly.
Part 16 of 20 · How to Algo · Previous: Regime stability · Next: Position sizing
When a strategy has a bad stretch, the reflex is to add a filter: only trade when the higher timeframe agrees, only when delta confirms, only when volume is above average. The backtest usually agrees, because the filter was chosen after looking at the bad stretch. Out of sample, the filtered strategy usually does worse than the original.
That is not a guess. When we tested confirmation filters systematically on strategies that already worked, most of them made those strategies worse. This part explains the arithmetic behind that and how to test a filter so it has a fair chance to prove otherwise.
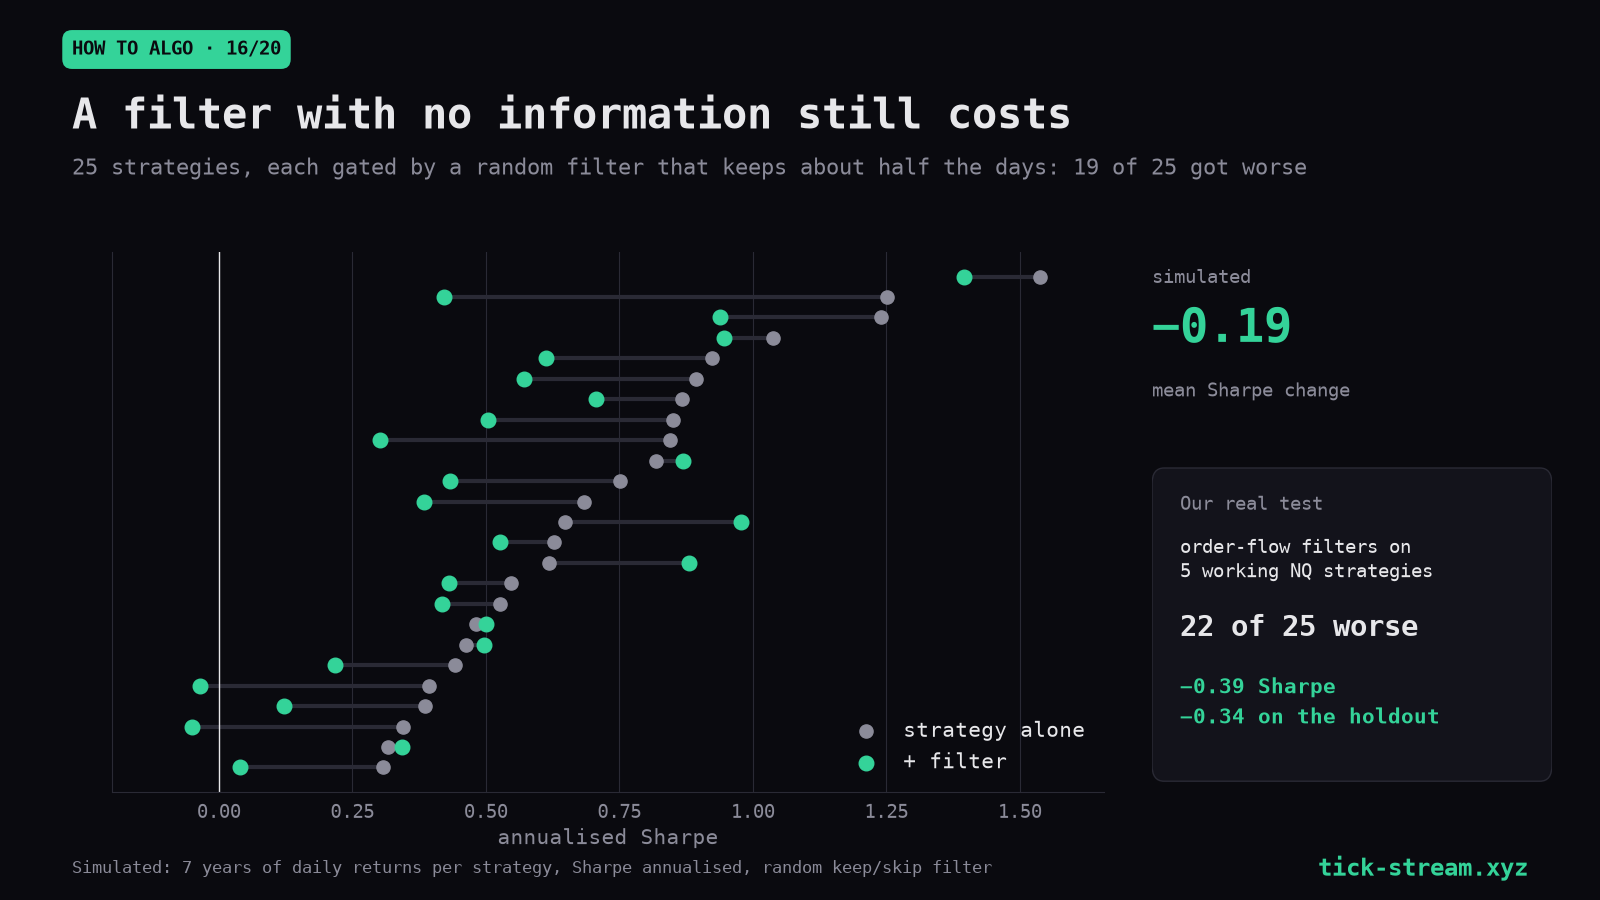
The chart shows why a filter starts behind. In a simulation, 25 strategies were each gated by a filter with no information that kept about half the days: 19 of 25 got worse, by 0.19 Sharpe on average, before any filter had a chance to be wrong.
The evidence
Order-flow filters on profitable daily strategies. We took five independently profitable daily strategies on NQ, including a short-term dip-buying rule, two trend rules, a breakout rule and plain always-long, and applied five cumulative-delta gates to each: CVD sign agrees with the trade, CVD rising, no price/flow divergence, and so on. 22 of 25 combinations got worse, by 0.39 Sharpe on average, and by 0.34 in the holdout alone. The filters kept a median of 50% of the trades. Less trading and worse results. The order-flow article has the overlay chart.
The same battery on gold. Twelve order-flow signals and their filter versions, unchanged, on GC from 2019: 20 of 20 combinations worse, mean change −0.370 Sharpe. Two very different instruments, almost the same damage.
A delta confirmation on ES VWAP bands. Fading VWAP sigma bands with and without the cumulative-delta confirmation that tutorials add: the filter cost money at every band width, −$9.75, −$1.79, −$3.52 and −$16.76 a trade, helping in 0 of 4. It was worst where it discarded the most. VWAP bands with CVD.
A higher-timeframe bias with a precise entry. On NQ, a daily bias held on its own earned +$89k. The same bias traded through one-hour pullback entries, the “better price” taught everywhere, made −$48k. HTF bias, LTF entry.
Pattern filters on a pullback. On a candle-body level rule on NQ, removing the higher-timeframe filter improved the result from +$30.9k to +$42.9k. On a decelerating-support setup at 30 minutes, buying any green candle after a down move made +$11k where the full pattern lost $22k. The decel test. The filters were subtracting value.
The arithmetic: filters start behind
Suppose a filter has no information at all and removes trades at random, keeping a fraction f. The average trade is unchanged. The number of trades falls to f times the original. Because the t-statistic and the annualised Sharpe scale with the square root of the number of independent bets (Part 10), both fall by a factor of √f.
| Share of trades kept | Sharpe of an uninformative filter, relative to original |
|---|---|
| 90% | 0.95 |
| 75% | 0.87 |
| 50% | 0.71 |
| 25% | 0.50 |
So a filter that keeps half the trades must raise the average trade by about 41% just to break even on Sharpe. Most filters do not improve the average trade at all, and so they lose roughly the √f penalty plus whatever they actively get wrong.
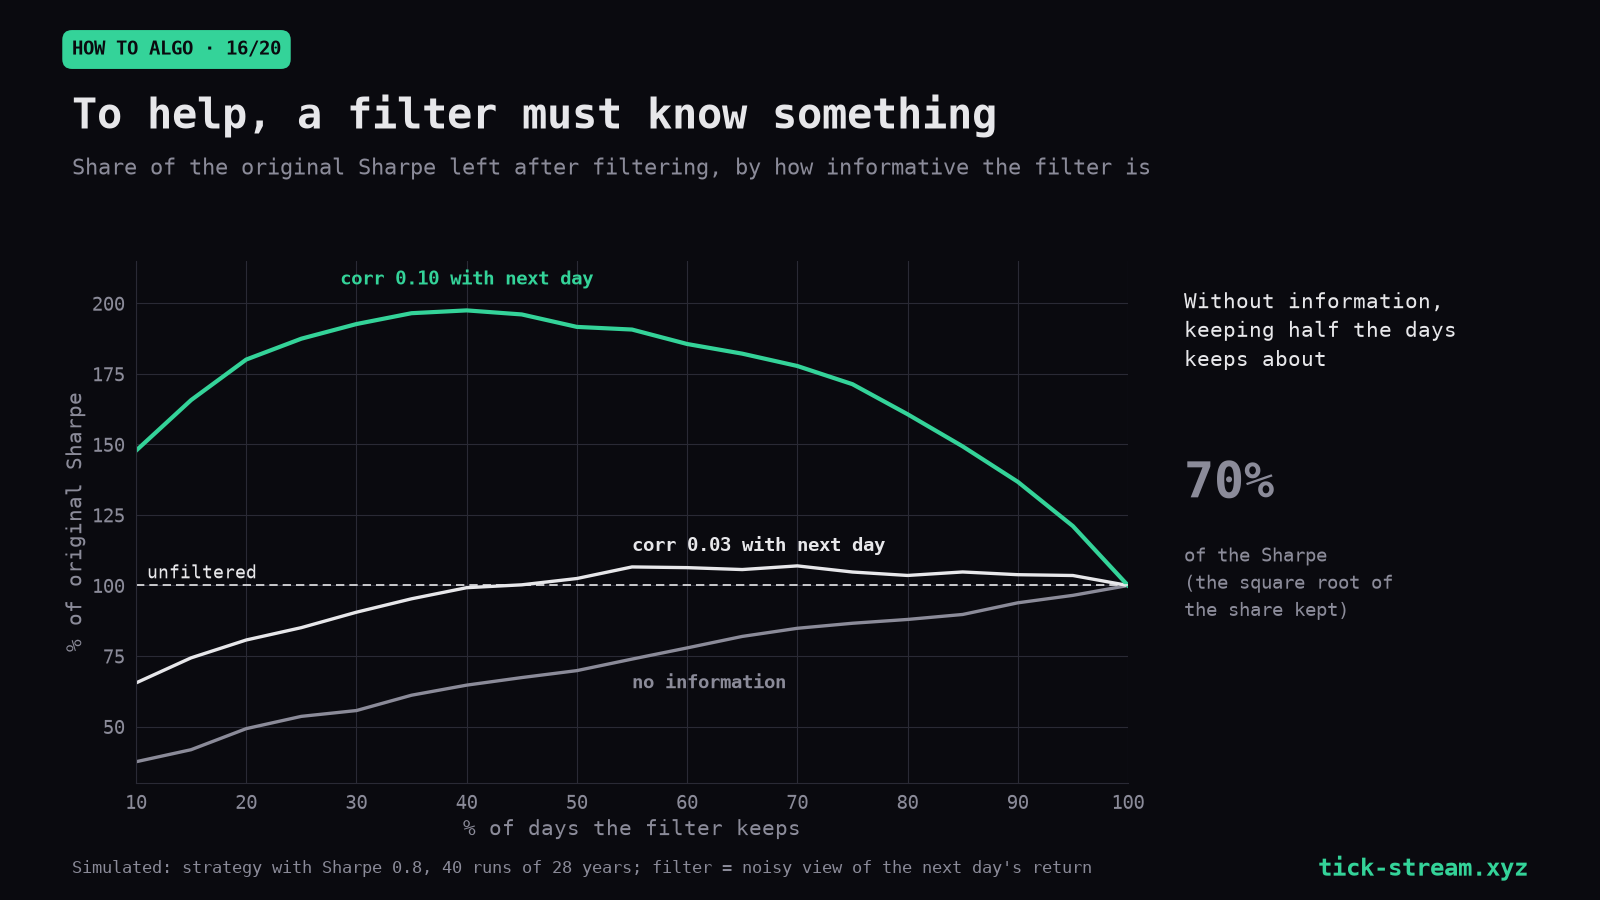
The simulation behind the chart puts numbers on “must know something”: a filter with no information that keeps half the days keeps about 70% of the Sharpe, the √0.5 of the table. Only filters with a real correlation to the next day’s outcome climb above that curve.
Why confirmation filters are often worse than random
Random filters lose only the √f penalty. Many real filters do worse, for three reasons.
They select on the past move. “Delta agrees with my direction” mostly means “the last few days already went my way”. On a market that mean-reverts over days, and NQ does in our data, that is a mild contrarian signal against the trade. The hardest gates, CVD sign agrees and CVD rising, were the most damaging in our overlay test.
They are coincident. Order flow describes the move that is happening, not the next one: on NQ, daily CVD correlated about +0.27 with the same day’s move and essentially zero with the next day’s. A filter built on a coincident variable cannot add forward information.
They are fitted to the bad stretch. A filter added after looking at a losing period is selected to remove that period. That is in-sample fitting, and it costs a degree of freedom you probably did not count (Part 11).
How to test a filter fairly
- Start from a strategy that is already profitable on its own. Testing filters on noise strategies tests noise. Our own first overlay run used archetype strategies with Sharpe ratios of 0.07 to 0.20; it told us nothing and we had to redo it on strategies that actually worked.
- Compare on Sharpe or average trade, never total P&L. A filter can only remove trades, so total profit falls mechanically even for a good filter.
- Build a random filter with the same keep rate and run it a few hundred times. The real filter has to beat most of those runs. On our ES trend pullback, a wick filter lost $24.46 a trade and a random filter with the same trade count lost $23.58: the “selection” was worse than chance.
- Check the holdout separately. A loose order-flow gate in our test helped three long-biased strategies by about 0.18 Sharpe in-sample, hurt a trend strategy by 0.26, and on the dip-buying strategy flipped from +0.19 in training to −0.37 in the holdout.
- Report how many trades the filter keeps. A filter that keeps 10% of trades needs an enormous improvement in average trade to matter.
What a promising filter looks like
The best filter result we have is still only a candidate. Gating ES RSI-2 on the previous session’s dealer gamma raised the average trade from $554.07 to $716.16. Against 500 random gates keeping the same number of trades, 6.4% matched it: close to, but not past, the 5% line. And of three setups tested under the same gate, it helped one. Gamma as a filter on ES setups.
That result has the features a good filter needs: a mechanism measured independently (negative gamma comes with larger ranges), a comparison against random gates, and an honest verdict. Filters tied to a volatility mechanism have done better in our work than filters that try to confirm direction, because volatility is forecastable and direction mostly is not.
A filter is a sizing rule with two settings
It helps to see a filter for what it is: a position size that can only be 0 or 1. If you believe a condition makes trades worse, the gentler test is to scale size down under that condition rather than switch the strategy off. A sizing tilt keeps the trade count, so it avoids most of the √f penalty, and its effect on Sharpe shows directly whether the condition carries information. If a tilt does not help, a hard filter built on the same condition will not either.
Two habits keep filter research honest. Add one filter at a time and test each against its own random-filter distribution; stacking three filters and testing the stack hides which one did the damage. And record every filter you tried, including the ones you dropped, because each is another variant in the count from Part 11.
Checklist
- Before adding a filter, compute the √f penalty for its keep rate.
- Test filters only on strategies that are profitable without them.
- Compare on Sharpe or average trade, not totals.
- Run a random filter with the same keep rate a few hundred times.
- Require the real filter to beat at least 95% of random filters.
- Confirm the improvement in the holdout.
- Be most suspicious of filters added after seeing a bad period.
- Prefer filters with an independently measured mechanism, usually volatility.
If a filter is a crude way of trading less in bad conditions, sizing is the precise way. Part 17: Position sizing and volatility targeting for futures.
Frequently asked questions
Do filters improve trading strategies?
In our tests, usually not. Five cumulative-delta filters applied to five independently profitable daily strategies on NQ made 22 of the 25 combinations worse, by 0.39 Sharpe on average and 0.34 in the holdout. The same battery of twelve order-flow signals on gold made 20 of 20 combinations worse. Filters cut trades, and most of them cut good and bad trades alike.
Why does adding a confirmation filter often make results worse?
A filter with no information keeps the average trade and cuts the number of trades, so the Sharpe ratio and the t-statistic fall by the square root of the share kept: keeping half the trades costs about 29%. Confirmation filters often do worse than that, because order flow is coincident: on NQ, daily CVD correlated about +0.27 with the same day's move and essentially zero with the next day's.
How do you test whether a filter adds value?
Compare it with a random filter that keeps the same share of trades, run a few hundred times, and require the real filter to beat at least 95% of them. Compare on Sharpe or average trade, never on total profit, because removing trades lowers totals mechanically. Do it on a strategy that is already profitable, and confirm it in the holdout.
Is a strategy with fewer, higher-quality trades better?
Only if the average trade rises by more than the trade count falls. A filter that keeps half the trades must raise the average trade by about 41% just to keep the same Sharpe. In our order-flow test the filters kept a median of 50% of the trades and still made 22 of 25 strategies worse.
Are there filters that work?
Some show promise. A negative-gamma gate raised ES RSI-2 from $554.07 a trade to $716.16, but 6.4% of 500 random gates with the same trade count matched it, so we classify it as a candidate. Filters tied to a measured volatility mechanism have done better in our work than filters that try to confirm direction.