The S&P's Variance Risk Premium Is Zero and the Bid-Ask Is Twenty-Five Times Bigger
Across 1,828 overlapping observations from our own OPRA chain, ATM implied volatility on 20-to-40-day SPY options averages 16.41% and the realised volatility of the following 21 sessions averages 16.43%. The premium is −0.03 volatility points at t = −0.12, p = 0.9006. It is positive on 61.5% of sessions, which is the whole shape of the thing: sellers are right three times in five and the losses are larger than the wins. Crossing the bid-ask on the same option costs 0.76 volatility points at the median.
Over 2019 to 2026 the variance risk premium on the S&P is zero. Mean at-the-money implied volatility on 20-to-40-day SPY options is 16.41%, and the realised volatility of the following 21 sessions averages 16.43%. The premium is −0.03 volatility points, t = −0.12, p = 0.9006, across 1,828 overlapping observations from our own OPRA chain.
That is not a small premium. It is nothing, before anyone has paid to collect it. And the median cost of crossing the bid-ask on the option that would collect it is 0.76 volatility points.
The claim being tested
Implied volatility sits above the volatility that follows. Option buyers pay for insurance, option sellers are paid to carry the risk, and the gap between the two is a fee rather than a forecast error. That is the variance risk premium, and it is the foundation under most options-selling businesses: the wheel, the covered call fund, the short strangle service, the “sell premium, time is on your side” pitch.
The claim is testable directly. You do not need a strategy to test it. You need the implied number, the realised number that followed it, and the same units on both.
The rule
No trades in this article. It is a measurement.
- For each session, take ATM implied volatility from the SPY calls with 20 to 40 days to expiry in our own OPRA chain, annualised.
- Measure the realised volatility of the following 21 sessions from ES cash returns, annualised the same way.
- The premium is implied minus realised, in volatility points. Positive means implied was rich.
- Observations overlap, because each session’s forward window covers the next 21. The t-statistic is not corrected for that, which if anything overstates significance rather than hiding it.
- Carry the median relative bid-ask spread of the same 20-to-40-day options through every result, converted into the same volatility points.
What implied and realised actually did
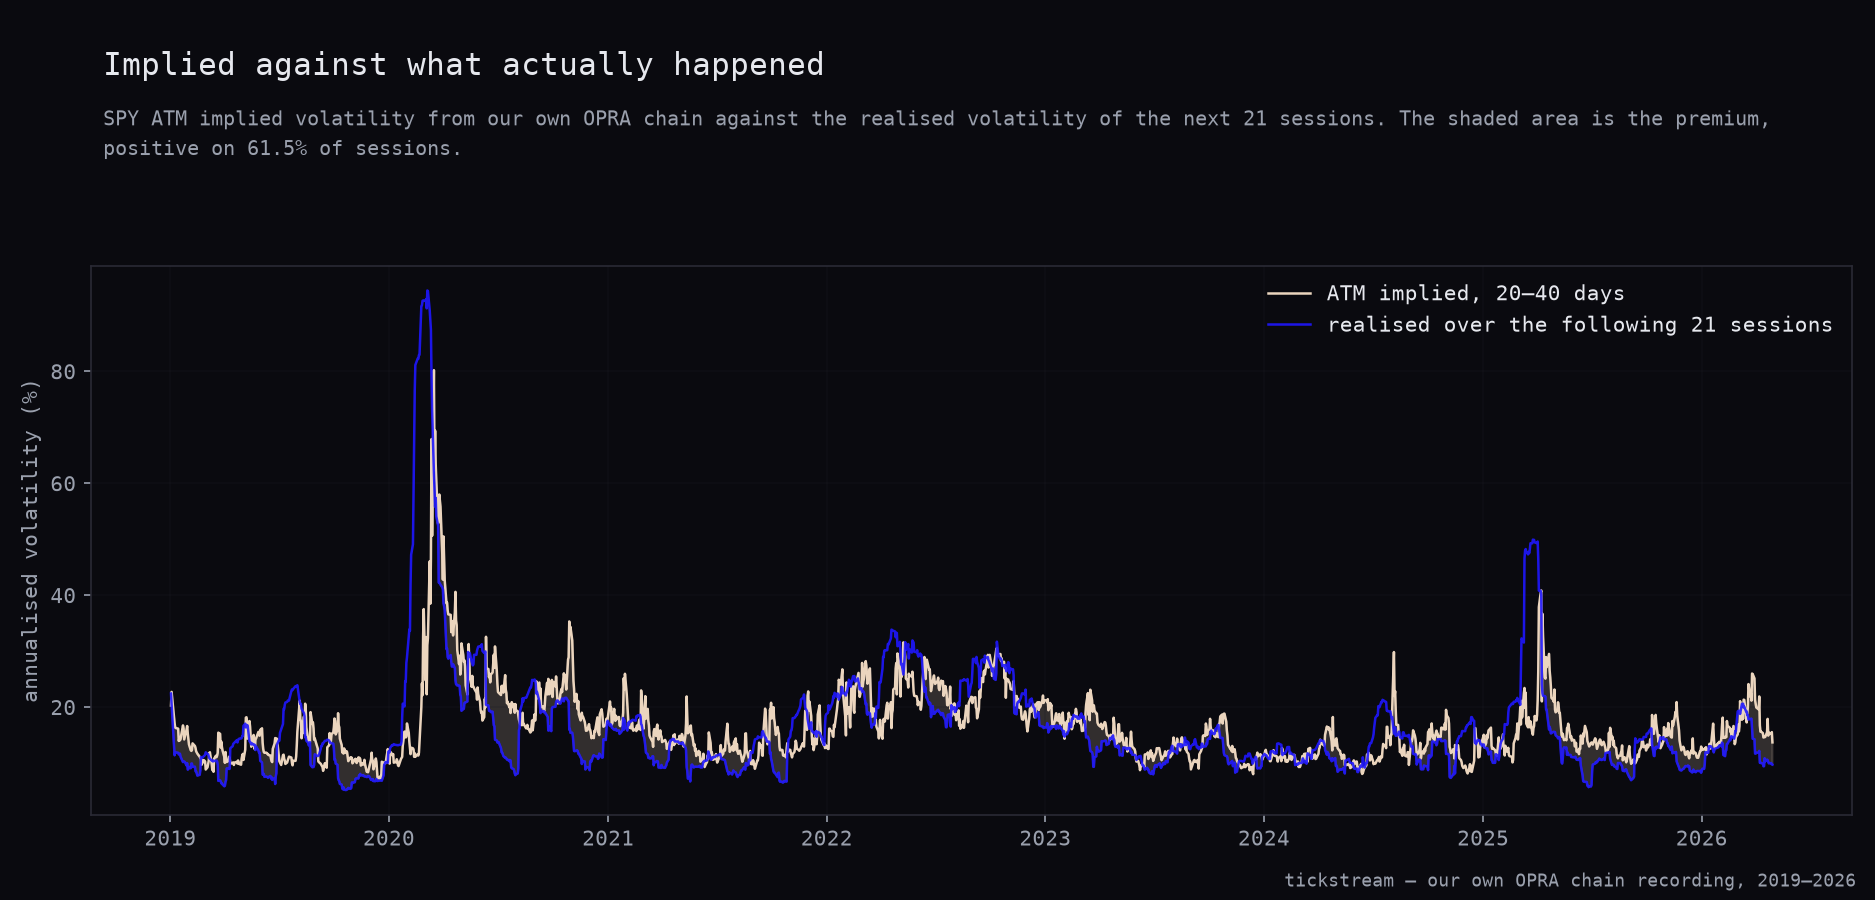
The two lines below are the whole test. The shaded area between them is the premium. What to look at is not the average gap, which is invisible, but the shape of the disagreements: implied runs above realised through the quiet stretches, and then gets buried in 2020 and again in the 2025 spike.
| Value | |
|---|---|
| Observations | 1,828 |
| Mean ATM implied | 16.41% |
| Mean realised, next 21 sessions | 16.43% |
| Mean premium | −0.03 vol points |
| Share of sessions premium positive | 61.5% |
| t | −0.12 |
| p | 0.9006 |
Those last two rows deserve their own paragraph, because together they are the interesting part.
The premium is positive on 61.5% of sessions and averages −0.03 volatility points. Both are true at once. The premium is there most of the time and it averages nothing, which means the sessions where implied is wrong are far more wrong than the sessions where it is right. Sellers are right three times in five. The two losses cost more than the three wins.
This is the number that gets sold as a win rate, and it is why short-volatility track records look excellent right up until they do not. A 61.5% hit rate is a real property of the trade. It is also compatible with a mean of zero, and here it is.
The cost, which settles it
The median relative spread on a 20-to-40-day SPY option is 5.19% of the option’s price. Converted into the same units as everything above, crossing that spread once costs 0.76 volatility points.
The premium is −0.03 volatility points. The spread alone is more than twenty-five times larger, and it points the wrong way.
A premium you cannot cross the spread to collect is not a premium. It is the market maker’s compensation, and a retail seller crossing to get at it is funding that compensation rather than earning it. This is exactly what our Black-Scholes test on QQQ chains found from the strategy side: selling the 30-day ATM straddle at the actual bid every month produced Sharpe −0.42.
We wrote at the time that the premium was real but smaller than the spread. On the S&P, over these seven years, the first half of that sentence does not survive either.
Where the premium actually is
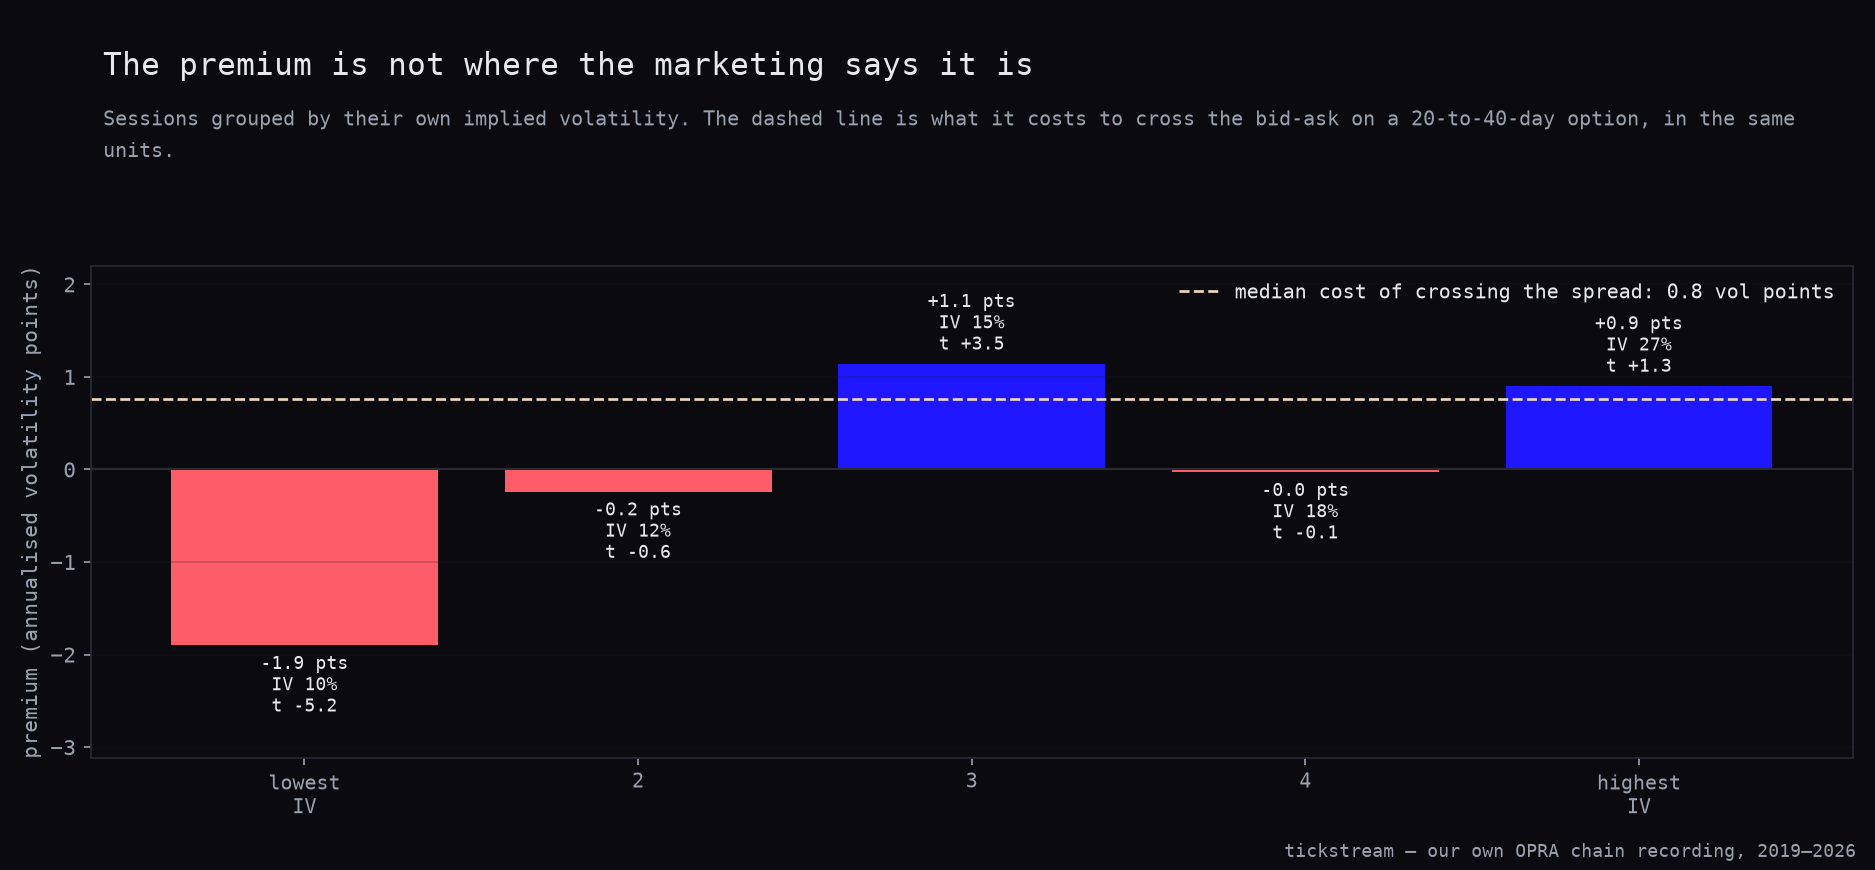
The premium is not constant, so we graded sessions by their own implied volatility into five equal buckets. The dashed line across the chart is the median spread cost, drawn in the same units, which is the bar every bucket has to clear before any of this is collectable.
| Bucket | Sessions | Mean implied | Premium | t | p |
|---|---|---|---|---|---|
| Lowest IV | 366 | 10.23% | −1.90 pts | −5.21 | 0.0 |
| 2 | 365 | 12.38% | −0.24 pts | −0.57 | 0.5720 |
| 3 | 366 | 14.77% | +1.14 pts | 3.55 | 0.0004 |
| 4 | 365 | 18.02% | −0.03 pts | −0.07 | 0.9466 |
| Highest IV | 366 | 26.63% | +0.90 pts | 1.32 | 0.1883 |
Two things to draw out of that table.
The first is the lowest bucket. Selling volatility when volatility is cheap is a significant loser: −1.90 volatility points at t = −5.21, with p rounding to zero on 366 sessions. That is the strongest single result in this article, and it runs against the seller. It is also where most retail premium selling happens, because a 10% implied volatility screen looks calm and the trades look safe. Cheap volatility is cheap because it is about to be worth more.
The second is the shape. It is not monotone. The middle bucket at +1.14 points is the only significant positive, and the highest bucket, where the theory says the premium should be largest, comes in at +0.90 points and does not clear significance. With five buckets tested, one clearing p = 0.05 is roughly what chance produces on its own. So we are not going to claim the middle bucket is a strategy, and we would not trade it.
Year by year
| Year | Premium, vol points |
|---|---|
| 2019 | +1.19 |
| 2020 | −2.80 |
| 2021 | +1.76 |
| 2022 | −1.85 |
| 2023 | +1.35 |
| 2024 | −0.33 |
| 2025 | −0.34 |
| 2026 | +2.69 |
Four positive years and four negative ones. This is what a zero-mean quantity looks like when you cut it into calendar slices, and it is why the year column matters more than the average.
Anyone selling a short-volatility track record built on 2019, 2021, 2023 and 2026 is selling half a table. The other half is in the same file.
Implied volatility does have a job
None of the above says implied volatility is uninformative. It says the gap between implied and realised is not a fee. The number itself forecasts volatility, and it does so well.
| Predictor | Target | r | p | n |
|---|---|---|---|---|
| Yesterday’s range | Next session’s range | +0.6547 | 0.0 | 1,848 |
| ATM implied volatility | Next session’s range | +0.5261 | 0.0 | 1,848 |
| ATM implied volatility | Next session’s absolute move | +0.3568 | 0.0 | 1,848 |
| ATM implied volatility | Next session’s direction | +0.0167 | 0.4726 | 1,848 |
Implied volatility correlates 0.5261 with the next session’s range, which is a genuinely useful forecast. Against direction it scores 0.0167 at p = 0.4726, which is nothing at all, and that distinction is worth keeping straight whenever an options-flow pitch slides from one to the other.
Then there is the control. Yesterday’s range forecasts the same target at 0.6547, and it costs nothing to compute. So implied volatility is a real volatility forecast that loses to the free one. That is the same verdict our session entropy test reached about a completely different indicator, and the same one the dealer gamma test reached about the gamma board. Three different inputs, three real forecasts, all behind one subtraction anyone can do for free.
What this does not say
It does not say options selling cannot work. We want to be explicit about that, because the headline invites the wrong reading.
What it says is narrower and harder. On the S&P, over these seven years, the raw premium was zero before costs. So any options-selling business that is actually profitable is being paid for something other than the raw premium. Strike selection is one candidate. Timing is another. Bearing the tail that the average hides is a third, and the −2.80 of 2020 is what that tail looks like from the seller’s side.
Those are all testable claims, and none of them is “implied volatility is systematically rich”.
What we changed
Nothing in the book, because we were not short volatility. What changed is the explanation for a result we already had.
We found that selling volatility as a taker loses on the Nasdaq, and we filed it under costs: the premium exists, the spread eats it. This test says the first half was wrong on the S&P. There was no premium to take. The spread was never eating a fee, it was the only number in the trade with a reliable sign.
The one options-buying exception we have found still stands, and it is consistent with this. On our contrarian sleeve’s signal days the realised move exceeds what the morning straddle prices in, which is a statement about specific days and not about the average. An average of −0.03 volatility points leaves plenty of room on both sides.
The ES archive this ran against is for sale in the historical data packages, ticks back to 2014.
Methodology: SPY option chains from our own OPRA recording, one row per contract per session with the exchange’s greeks, open interest and volume, joined to ES cash sessions built from our own tick archive. 1,849 chain sessions from 2 January 2019 to 29 May 2026, of which 1,828 have a complete 21-session forward window; correlation tests use 1,848. Implied volatility is the ATM call, 20 to 40 days to expiry, annualised; realised volatility is the standard deviation of the next 21 ES cash returns, annualised at √252. Forward windows overlap, so the t-statistics overstate rather than understate significance. Spread cost is the median relative bid-ask of the same 20-to-40-day options, 5.19% of premium, converted to 0.76 volatility points at the median implied level. Three limits apply. Our chain store starts in 2019, so this is a seven-year test against the twelve and a half years of ES ticks the rest of this series uses. Open interest is a daily OCC figure describing the state at the START of a session, not intraday. Sessions after 29 May 2026 are excluded because the recorder’s last snapshot of the day is sometimes a truncated post-close chain from which the ATM reference cannot be built. Correlations are Pearson, two-sided p. No trades are simulated here; where this series does simulate them the cost convention is $4.50 commission plus two ticks per round trip, $29.50 on one ES contract.
Frequently asked questions
Is there a variance risk premium on the S&P?
Not over 2019 to 2026, and not in our data. Mean ATM implied volatility on 20-to-40-day SPY options is 16.41% against 16.43% realised over the following 21 sessions, a premium of −0.03 volatility points with t = −0.12 and p = 0.9006 on 1,828 observations. That is a statistical zero, measured before any cost of trading it.
If the premium is zero, why do volatility sellers win most of the time?
Because winning often and earning nothing are compatible. The premium is positive on 61.5% of sessions and averages −0.03 volatility points, so the sessions where implied is wrong are far more wrong than the sessions where it is right. Three wins in five do not cover two losses of that size.
How much does it cost to collect the premium?
More than the premium. The median relative bid-ask spread on a 20-to-40-day SPY option is 5.19% of the option's price, which is 0.76 volatility points in the same units as the premium itself. Against a premium of −0.03 points, the spread alone is more than twenty-five times larger.
Is the premium at least there when volatility is high?
Not reliably. In the highest implied-volatility quintile, mean implied 26.63%, the premium is +0.90 volatility points at t = 1.32 and p = 0.1883, which does not clear significance. The only significant positive bucket is the middle one at +1.14 points, and one bucket in five clearing p = 0.05 is roughly what chance produces.
Is implied volatility useless then?
No. It correlates 0.5261 with the next session's range and 0.3568 with the next session's absolute move, both with p rounding to zero on 1,848 sessions. It is beaten on the same target by yesterday's range at 0.6547, which is free. Against direction it scores 0.0167 at p = 0.4726.