Zero-Day Options Went From 8.6% to 53.8% of SPY Option Volume and the Last Hour Got Smaller
Same-day expiry options grew from 8.6% of all SPY option volume in 2019 to 53.8% in 2026, across 1,832 sessions of our own OPRA recording. Graded against its own trailing quarter, that share correlates with the same ES session's range at r = −0.0430 and with the last hour's share of the range at r = 0.0190, neither significant. The headline claim is backwards: the last hour was 0.447 of the ES range before May 2022 and 0.390 after, t = 7.27. Raw share correlates 0.7922 with the calendar, which is where the apparent findings come from.
Same-day expiry options on SPY grew from 8.6% of all option volume in 2019 to 53.8% in 2026. Everything people say that growth did to the tape — more pinning, more late-day violence, closes that run away from you — is not visible in the ES session at daily resolution, and the loudest version of the claim is backwards.
The last hour of the ES cash session accounted for 0.447 of the day’s range before SPY finished going daily-expiry. Afterwards it accounted for 0.390. The close got smaller, not bigger, at t = 7.27.
This piece is also a worked example of the trap that makes the opposite conclusion so easy to reach. Raw zero-day share correlates with the calendar at 0.7922. Almost every apparent finding about zero-day options is that number wearing a costume.
The data
The options half of this series runs on our own OPRA recording: one row per contract per session, with the exchange’s greeks, open interest and volume. The chain store starts on 2 January 2019, while the ES tick archive the rest of the series uses goes back to 2014. So this is a seven-year test inside a twelve-and-a-half-year archive, and nothing below reaches back before 2019. Where the extra five years carry a finding in this series, we say so. Here they do not exist.
Sessions after 29 May 2026 are excluded. The recorder’s last snapshot of the day is sometimes a truncated post-close chain, which breaks the ATM reference, so those rows are dropped rather than quietly averaged in. That leaves 1,832 sessions.
Note that 2026 in the year table is five months, not twelve.
The rule
- Zero-day share is the volume of SPY contracts expiring the same session, divided by the total SPY option volume that session, from the recorded chain.
- The ES side is the cash session only, built from minute bars: range is session high minus low, move is open to close.
- The late-hour window is 15:00 to 16:00 New York. Late-hour share of the range is the high-low range of that hour divided by the high-low range of the whole session.
- Sessions with fewer than 300 cash-session minutes are dropped.
- The detrended version grades each session’s share against its own trailing 60-session mean and standard deviation. A heavy 2020 session and a heavy 2025 session are then both heavy relative to their own era.
- Nothing here is traded, so no cost assumption is doing any work in this article. Where this series does trade, it charges $29.50 a round trip.
The growth is real and it is enormous
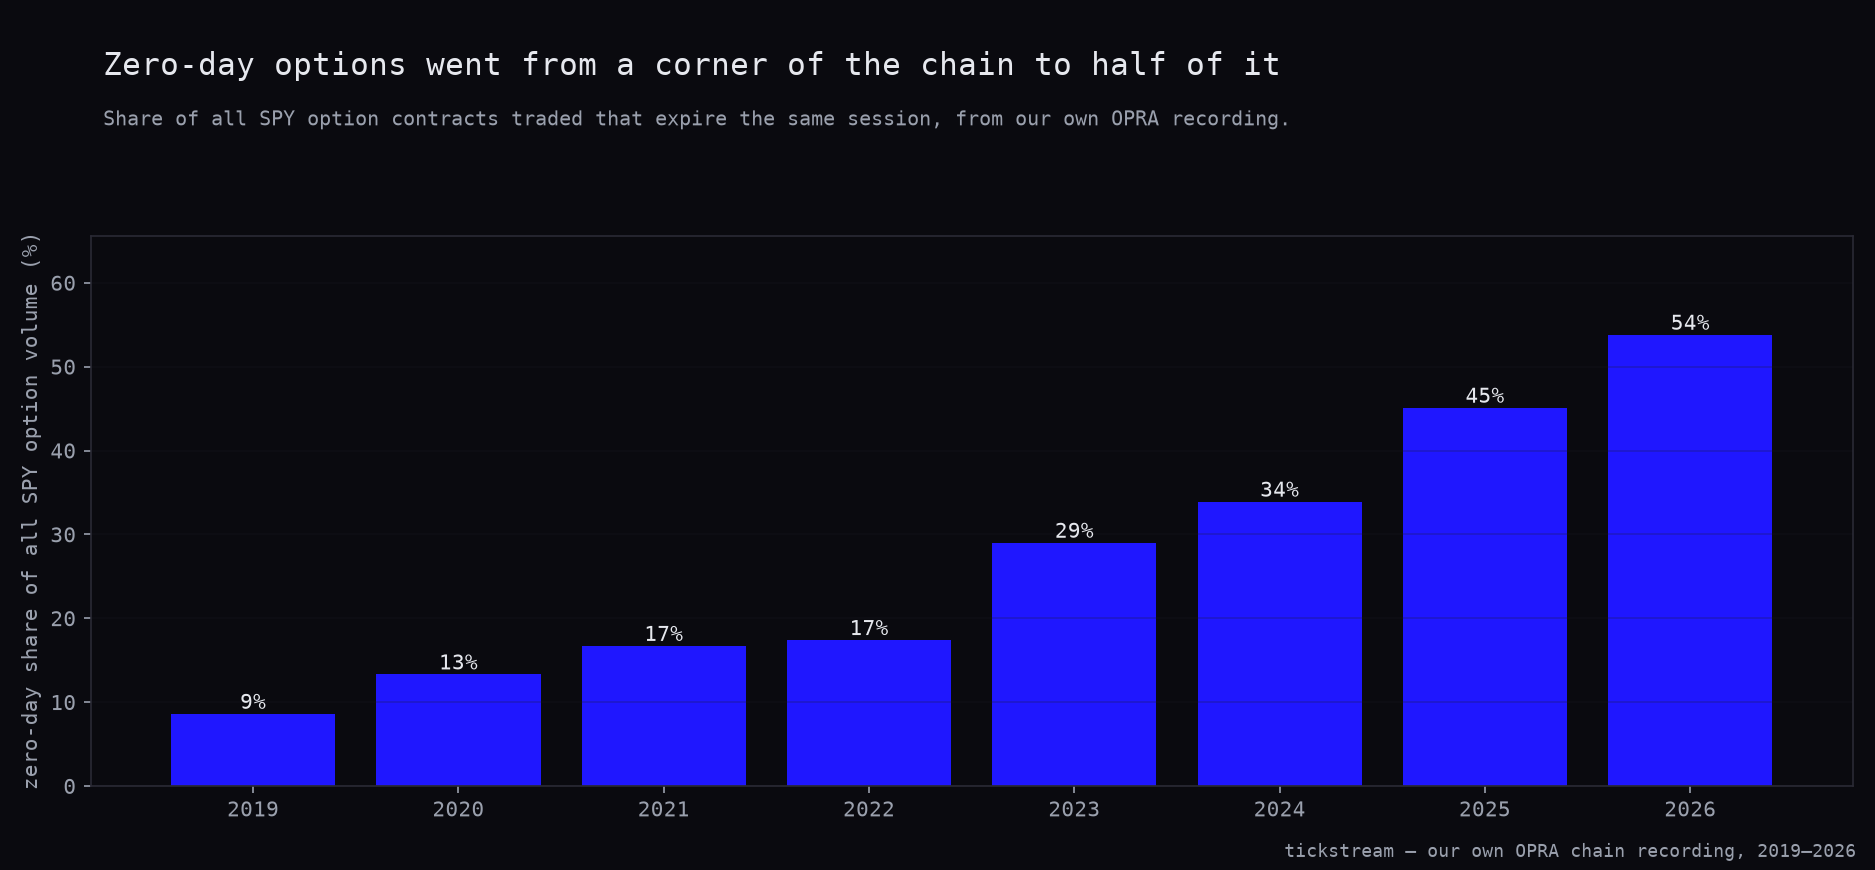
This is the part of the story that survives every check. The share by calendar year, from the recorded chain.
| Year | Zero-day share of SPY option volume |
|---|---|
| 2019 | 8.6% |
| 2020 | 13.3% |
| 2021 | 16.7% |
| 2022 | 17.4% |
| 2023 | 29.0% |
| 2024 | 33.9% |
| 2025 | 45.1% |
| 2026 | 53.8% |
Across all 1,832 sessions the mean is 25.2%. The single heaviest session was 69.7%. The first session ever to clear 40% was 20 April 2022, which lines up with SPY completing its Monday-to-Friday expiry schedule that year.
The chart below is that table. What to look at is the step between 2022 and 2023, where the share rises by two thirds in one year — that is the expiry calendar filling in, not a change in appetite.
The trap, in one number
Correlate the raw zero-day share against what ES did, and you get results that look like findings.
| Raw zero-day share against | r | p | n |
|---|---|---|---|
| Same session’s ES range | 0.1506 | 0.0000 | 1,832 |
| Next session’s ES range | 0.1816 | 0.0000 | 1,831 |
| Late-hour share of the ES range | −0.1142 | 0.0000010 | 1,826 |
| Calendar time | 0.7922 | 0.0000 | 1,832 |
The first two rows are the ones that get quoted. Both have p rounding to zero. Neither means anything, because of the last row.
The share went from 9% to 54% over the window. It is, to a first approximation, a clock. Anything else that also trended across those seven years will correlate with it, and range did trend: the period since 2022 has been a higher-volatility era than 2019, so range correlates with time, and therefore with the zero-day share, for reasons that have nothing at all to do with options.
The general form is worth stating, because it applies to every fast-growing market structure variable, not just this one. When a variable’s correlation with the calendar is 0.79, its correlation with anything else is a claim about the calendar until you remove the trend.
Removing it
So we grade the share against its own trailing quarter instead of using the raw level. Same variable, same sessions, the era subtracted out.
| Detrended zero-day share against | r | p | n |
|---|---|---|---|
| Same session’s ES range | −0.0430 | 0.0706 | 1,773 |
| Late-hour share of the ES range | 0.0190 | 0.4238 | 1,767 |
| Next session’s ES range | 0.0316 | 0.1837 | 1,772 |
| Next session’s ES move | −0.0166 | 0.4847 | 1,772 |
Nothing survives. The two raw correlations that had p rounding to zero come back at −0.0430 and 0.0316. The same-day one even flips sign, and at p = 0.0706 we are not going to name that sign either.
The late-hour number is the one the thesis needs most, and it is the weakest of the four at r = 0.0190, p = 0.4238. A heavier-than-usual zero-day session does not put more of the ES range into the close.
The buckets
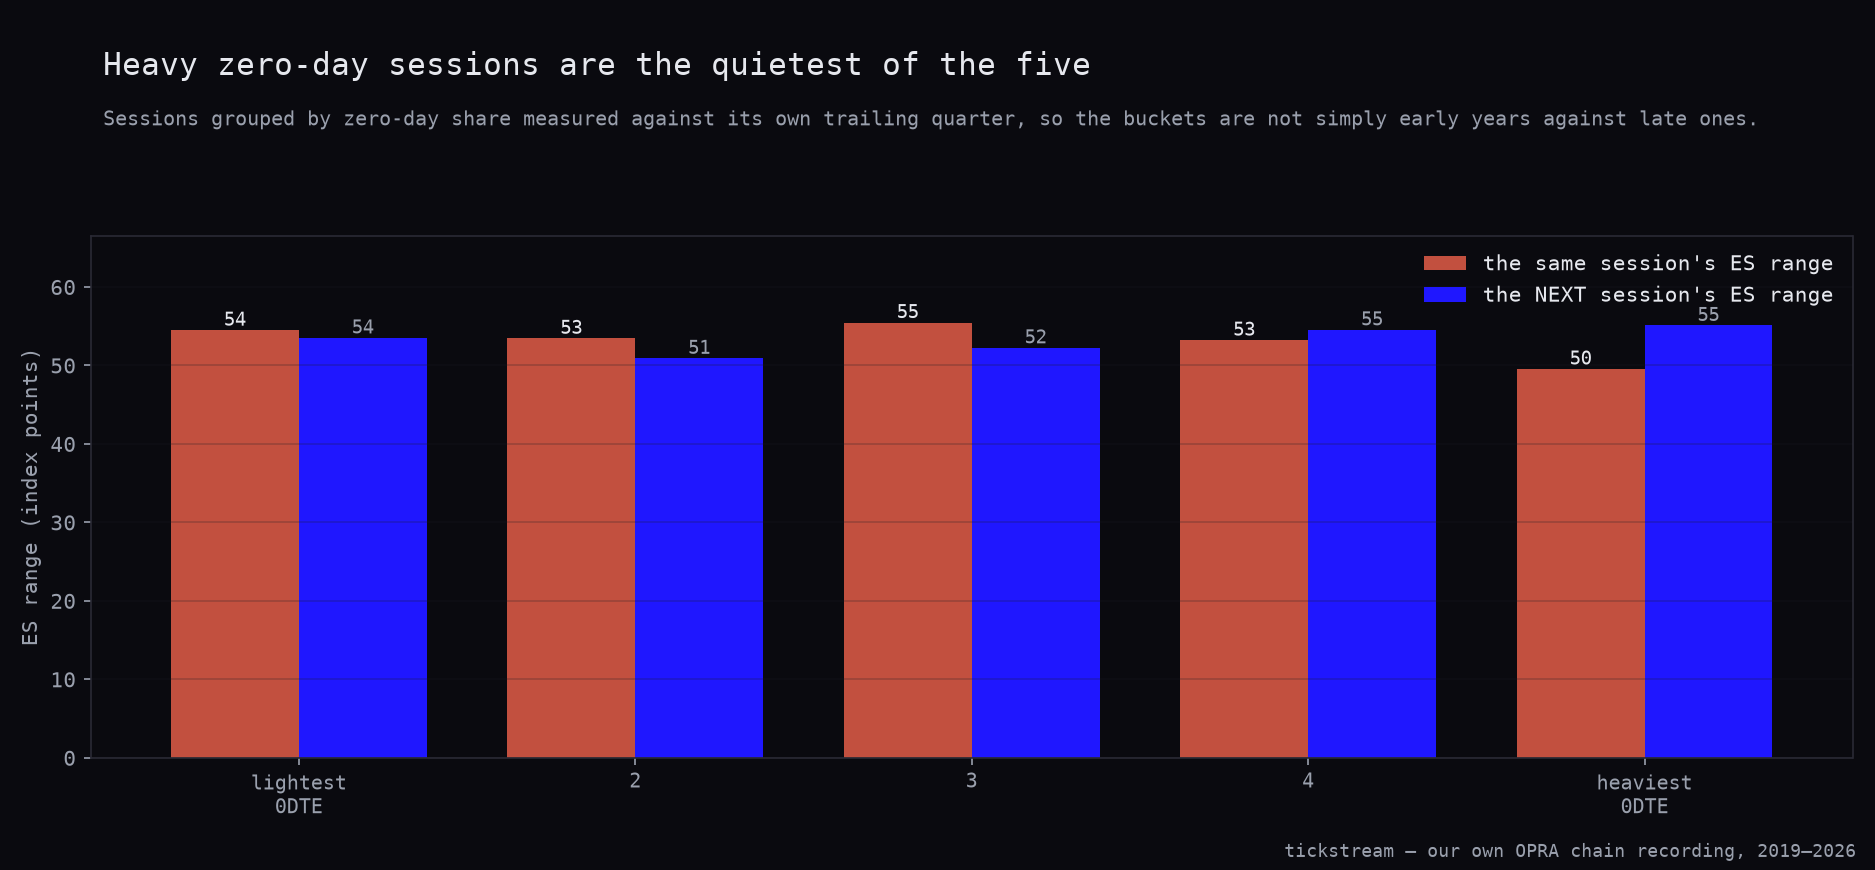
Correlations can hide a shape that only lives at one extreme, so we sorted the sessions into five equal groups by detrended zero-day share and read the ES sessions off each.
| Bucket | Sessions | Mean raw share | Same-day ES range | Late-hour share | Next-day ES range |
|---|---|---|---|---|---|
| Lightest 0DTE | 355 | 5.4% | 54.50 pts | 0.428 | 53.51 pts |
| 2 | 354 | 27.2% | 53.46 pts | 0.390 | 50.91 pts |
| 3 | 355 | 29.5% | 55.47 pts | 0.421 | 52.25 pts |
| 4 | 354 | 29.5% | 53.23 pts | 0.406 | 54.54 pts |
| Heaviest 0DTE | 355 | 37.3% | 49.55 pts | 0.429 | 55.10 pts |
The heaviest bucket has the lowest same-day range of the five, at 49.55 points, below every one of the middle three. Heavy zero-day sessions are, if anything, slightly quieter than average. That is not an edge and we are not presenting it as one — the spread across all five buckets is about six points on a fifty-point average — but it is the exact opposite of the direction the story requires.
The late-hour column is flat across all five buckets. Whatever decides how much of an ES day happens after 15:00, it is not the zero-day share of the option tape.
One honest caveat on this table. The lightest bucket still carries a mean raw share of 5.4%, so the detrend has not fully scrubbed the calendar out of that group — light-by-its-own-standard sessions cluster in early years where the standard was low. The middle three buckets, at 27.2%, 29.5% and 29.5% raw, are the clean comparison, and they are flat.
The chart pairs each bucket’s same-day range against the next session’s. The heaviest bucket carries the shortest same-day bar of the five.
The claim that is backwards
SPY completed its daily expiry schedule in 2022, so the natural before-and-after cut is 1 May 2022: 819 sessions before, 1,013 after. Mean zero-day share was 13.4% before and 34.7% after, so the split does what it is supposed to do.
| Before 2022-05-01 | After | |
|---|---|---|
| Sessions | 819 | 1,013 |
| Mean zero-day share | 13.4% | 34.7% |
| Late-hour share of ES range | 0.447 | 0.390 |
| Mean ES cash-session range | 43.40 pts | 59.57 pts |
The late-hour row is the finding. Before the daily expiry schedule filled in, the last hour made 0.447 of the ES session’s range. After, it made 0.390. That is t = 7.27 with p rounding to zero, and it is one of the most statistically significant differences in this article. The last hour became a smaller part of the day, not a bigger one.
Then the row that explains why almost everyone believes the opposite. The mean ES range went from 43.40 points to 59.57. Sessions genuinely did get bigger — by about a third — and a trader who lived through both halves is remembering something real. They just did not get more back-loaded. The extra range showed up across the whole session, and the hour everyone watches actually shrank as a proportion of it.
And we cannot pin the bigger ranges on options. The same 1 May 2022 line separates 2022’s bear market, the entire rate-hiking cycle and everything else that happened afterwards from everything that came before. A before-and-after comparison with one cut point cannot tell those apart from the expiry calendar, and we are not going to pretend it can. That is the honest limit of this section: the late-hour result is a measurement, the range result is a coincidence of timing we cannot resolve.
What we are not claiming
This does not say zero-day options have no effect on anything.
It says that at daily resolution, on ES, the two effects most often attributed to them are absent once the calendar is removed: a louder close, and a change in range behaviour that tracks their growth. Both fail. The late-hour claim fails so hard it points the other way.
Intraday microstructure at the minute or second scale is a different question, and this test does not reach it. Pinning inside the final thirty minutes, dealer hedging flow around a single strike, the shape of the book into a 16:00 settle — none of that is measurable in a daily range statistic, and nothing above should be read as evidence about it.
What we changed in our own book
Nothing. We have no sleeve that keys off zero-day volume, and this test gives us no reason to build one. What it did change is a rule about how we read anything sourced from the option tape.
The zero-day share now sits on our short list of variables that must be graded against their own trailing window before anyone correlates them with anything. It joins the same discipline we applied to dealer gamma, where a regime effect was real but had to be checked against yesterday’s range: negative dealer gamma runs the S&P’s next range 1.7 times wider and still loses to yesterday’s range. The gamma-level family got the same treatment and did not survive it: we put 990 million option prints against gamma walls, and the daily version failed the same way once the control kept the side instead of mirroring it (gamma walls and max pain on ES).
For the one place zero-day options have earned a line in our book — as an execution vehicle rather than a signal — see same signal, two trades: naked future versus defined-risk 0DTE.
Method: SPY option chain from our own OPRA recording, one row per contract per session, 2 January 2019 to 29 May 2026, 1,832 sessions. Sessions after 29 May 2026 are excluded because the recorder’s last snapshot of the day is sometimes a truncated post-close chain. The ES side is the cash session built from our own minute bars, New York time; the ES tick archive itself starts in 2014 but no claim here reaches back past 2019. The late-hour window is 15:00 to 16:00 New York. Detrending is a 60-session rolling z-score of the zero-day share. Correlations are Pearson; the before-and-after test is Welch’s t-test on the late-hour share of the range. No position is simulated in this article, so no cost assumption applies; elsewhere in this series ES trades carry $4.50 commission plus two ticks, $29.50 a round trip.
Frequently asked questions
How big are zero-day options now?
On SPY they were 8.6% of all option volume traded in 2019 and 53.8% across the 2026 sessions in our window. The mean over all 1,832 sessions is 25.2%, and the single heaviest session reached 69.7%. The first session ever to clear 40% was 20 April 2022.
Do heavy zero-day sessions have wider ES ranges?
No. Graded against its own trailing quarter, the zero-day share correlates with the same session's ES range at r = −0.0430, p = 0.0706 — the wrong sign for the story, and not significant. The heaviest of five buckets averaged a 49.55-point ES range, the lowest of the five, against 53.46, 55.47 and 53.23 for the middle three.
Did the close get more violent after zero-day options went daily?
The opposite, and it is one of the most significant numbers we have measured in this series. The last hour was 0.447 of the ES session's range across the 819 sessions before 1 May 2022 and 0.390 across the 1,013 after, t = 7.27 with p rounding to zero. Sessions became more evenly distributed across the day, not more back-loaded.
But ranges did get bigger, didn't they?
Yes. The mean ES cash-session range was 43.40 points before the cut and 59.57 points after, which is why the story feels true to anyone who traded through it. We cannot attribute that to options: the same cut separates 2022's bear market and the whole rate cycle from everything before it. One cut point cannot tell those apart.
Why does the raw zero-day share appear to predict anything at all?
Because it is mostly a date stamp. The raw share correlates 0.7922 with calendar time, so any other variable that also trended over the seven years will correlate with it. That is where the raw r = 0.1506 against the same-day range and r = 0.1816 against the next day's range come from, and both collapse once the trend is removed.