Key Opens Are Revisited Less Often Than a Price With No Name
We tested three level families on 12.7 years of ES: the midnight, 08:30, 09:30 and 10:00 New York opens, the Fibonacci retracements, and rejection blocks. Given the same 240-minute forward window as a random minute of the same session, every key open is revisited less often — the 09:30 open by 9.1 percentage points at t = −15.49. Ten retracement depths all lose, between −$26.26 and −$29.63 a trade, and the five Fibonacci ratios beat the five ordinary ones by $0.46 at p = 0.5406. The rejection block lost $511,210.71 over 23,125 trades, and the placebo at a price the wick never marked lost $5.99 a trade more — under half an ES tick.
Given the same amount of session left to run, the 09:30 New York open is revisited on 88.2% of ES sessions and a randomly chosen minute of that same session is revisited on 97.3%. The key open loses by 9.1 percentage points at t = −15.49. All four opens we tested lose the same way, which makes this the first level family in the series that does not merely fail its control — it runs backwards through it.
We tested three families here: key opens, Fibonacci retracements and rejection blocks. Each names a price and claims the market treats it differently. Each gets a control that differs from the real level in the name and nothing else. All three die, and the first one dies pointing the other way.
The rule
- Key opens. Take the opening price of the first minute at or after midnight, 08:30, 09:30 and 10:00 New York. A revisit is price trading back through that exact level at any point in the next 240 minutes.
- Control for the opens: the opening price of a randomly chosen different minute of the same session, given its own 240-minute forward window. Same day, same instrument, same amount of session left. No name.
- Fibonacci. On five-minute bars, take the high and low of the last 24 bars as the swing. Direction comes from the close against a 50-period EMA. The entry is a limit at the retracement level, the stop one ATR beyond it, the target two ATR the other way, held at most 48 bars.
- Control for Fibonacci: the same trade at 0.30, 0.45, 0.55, 0.70 and 0.90, run alongside 0.236, 0.382, 0.50, 0.618 and 0.786.
- Rejection blocks. A five-minute bar with an upper wick worth more than 60% of its range and a lower close is a bearish block; the mirror is bullish. The level is the wick’s extreme. When price returns to it within 48 bars, trade the rejection with the same ATR bracket.
- Control for rejection blocks: the identical revisit trade at a price between 0.5 and 2.0 ATR from the bar’s close, which the wick never marked.
Costs are $29.50 a round trip on one ES contract: $4.50 commission plus two ticks at $12.50.
The revisit question is a trap
Ask “does price come back to the 09:30 open” and the answer is almost always yes. A minute later you are still standing on it. Anything that trades near a price will trade through it again shortly afterwards, and the opening print of a bar is by definition a price the market just touched.
So the whole test is the control, and our first one was broken. We compared the key open against a randomly chosen earlier price from the same session. That produced apparent edges of twenty-odd points with t-statistics above 20 — the kind of result that writes its own headline. It was an artefact. An earlier price is further away from the current market and has less session left in which to be reached, so the key open wins by construction and the level never has to do anything. Those figures are not in our results file because we discarded the run.
The published control fixes the one thing that mattered. Both anchors are minutes of the same session, and both get an identical 240-minute forward window. The only remaining difference is that one of the two prices has a name.
Every key open is revisited less often
Once the windows match, the direction flips.
| Key open | Sessions | Revisited | Random minute | Edge | t | p |
|---|---|---|---|---|---|---|
| Midnight (00:00 ET) | 3,826 | 94.7% | 97.3% | −2.6pp | −5.76 | 0.0 |
| 08:30 ET | 3,804 | 91.1% | 97.5% | −6.4pp | −12.21 | 0.0 |
| 09:30 ET | 3,778 | 88.2% | 97.3% | −9.1pp | −15.49 | 0.0 |
| 10:00 ET | 3,775 | 89.8% | 97.0% | −7.2pp | −12.68 | 0.0 |
Four rows, four negative edges, four p-values that round to zero at four decimals. The 09:30 open is the worst offender at −9.1 points. Midnight, the quietest of the four, is the closest to neutral at −2.6 points.
The chart below puts the two anchors side by side. Look at the grey bars first: a nameless minute sits above 97% in all four groups, which is the base rate this question actually has.
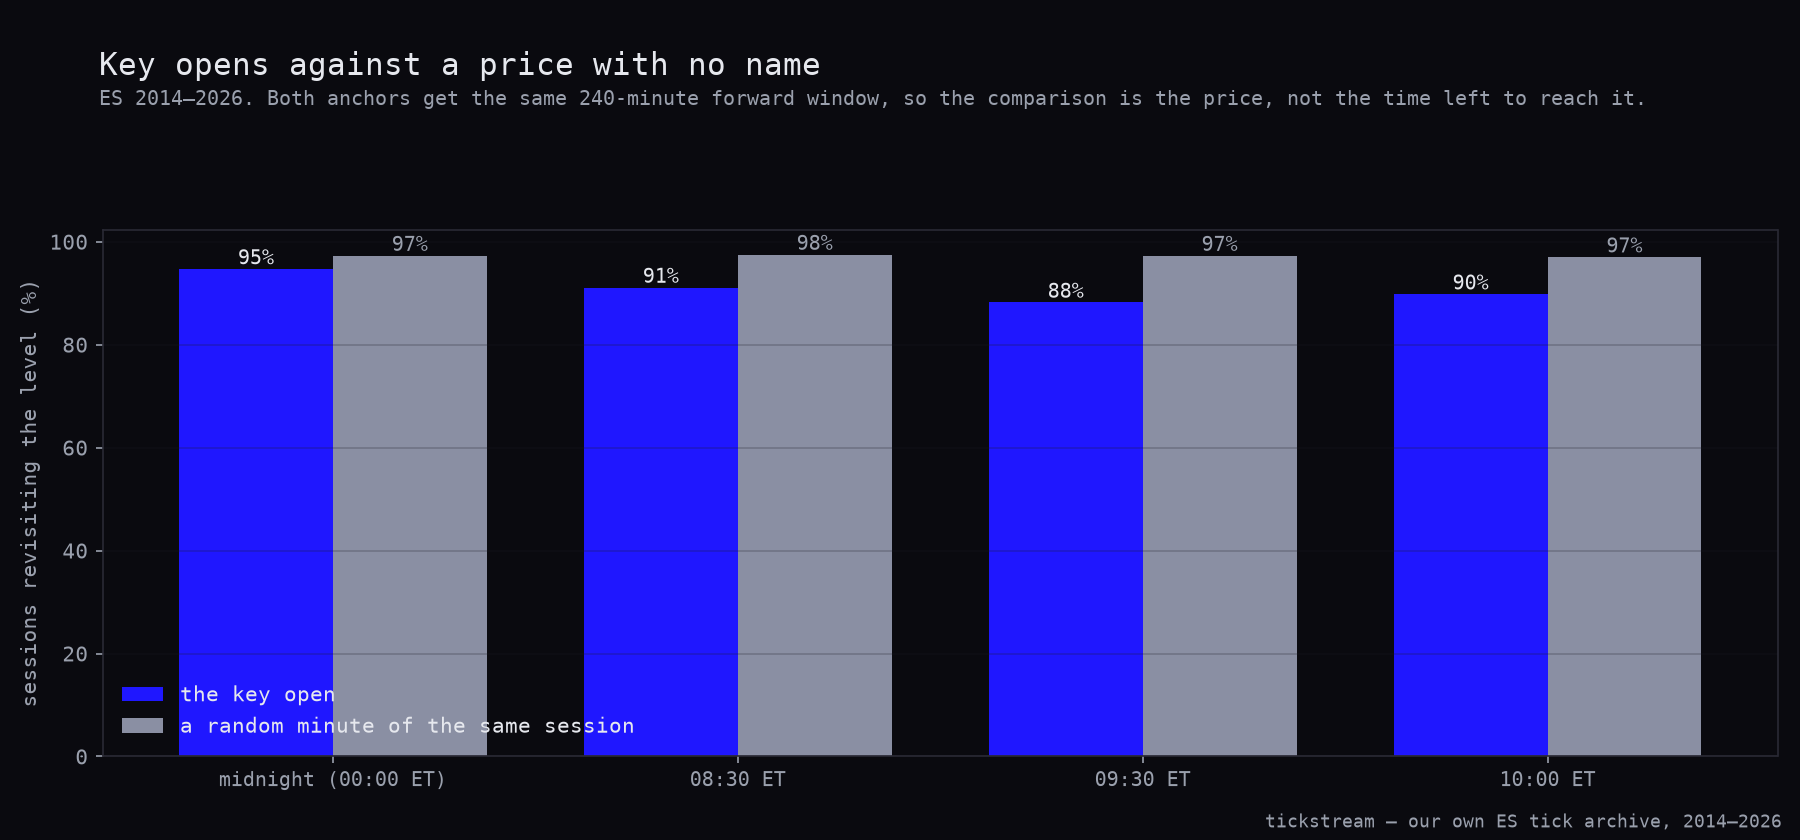
We have an explanation, and it is an explanation rather than a measurement — nothing in this test separates the two effects. Key opens land at moments of higher activity. Midnight rolls the session, 08:30 is when the data prints, 09:30 opens the cash market and 10:00 carries the second release slot. Price leaves those prices quickly and keeps going. A random minute is far more likely to fall in a quiet stretch, where the market chops around the same handful of ticks for an hour and revisits everything near it.
That is enough to produce the whole table without any level doing anything. What it is not is a magnet. The claim is not merely unsupported here; on twelve and a half years of ES it points the wrong way, at t-statistics between −5.76 and −15.49.
Fibonacci ratios are not the part doing the work
The retracement test runs the same trade ten times and changes only the depth. Five of the depths are famous. Five are numbers we picked to sit between them.
| Ratio | Fibonacci | Trades | Win rate | Average | Total |
|---|---|---|---|---|---|
| 0.236 | yes | 84,839 | 33.5% | −$26.74 | −$2,268,330.37 |
| 0.30 | no | 80,958 | 33.7% | −$27.21 | −$2,203,169.04 |
| 0.382 | yes | 69,642 | 33.7% | −$28.93 | −$2,014,866.47 |
| 0.45 | no | 58,933 | 33.7% | −$29.63 | −$1,746,119.21 |
| 0.50 | yes | 54,154 | 34.6% | −$26.26 | −$1,421,935.86 |
| 0.55 | no | 48,440 | 34.1% | −$27.81 | −$1,347,315.00 |
| 0.618 | yes | 42,767 | 33.8% | −$28.88 | −$1,235,174.41 |
| 0.70 | no | 35,106 | 34.1% | −$27.16 | −$953,320.21 |
| 0.786 | yes | 26,431 | 34.4% | −$27.49 | −$726,568.40 |
| 0.90 | no | 16,984 | 34.4% | −$28.81 | −$489,317.82 |
Every row loses. The band is narrow: −$26.26 a trade at the best depth, −$29.63 at the worst, with t-statistics running from −15.87 to −29.21. Win rates sit between 33.5% and 34.6% across all ten, which is what you get from a two-to-one bracket that carries no directional information.
The chart is the argument. Gold bars are the Fibonacci depths. If the ratios mattered, the gold bars would separate from the grey ones.
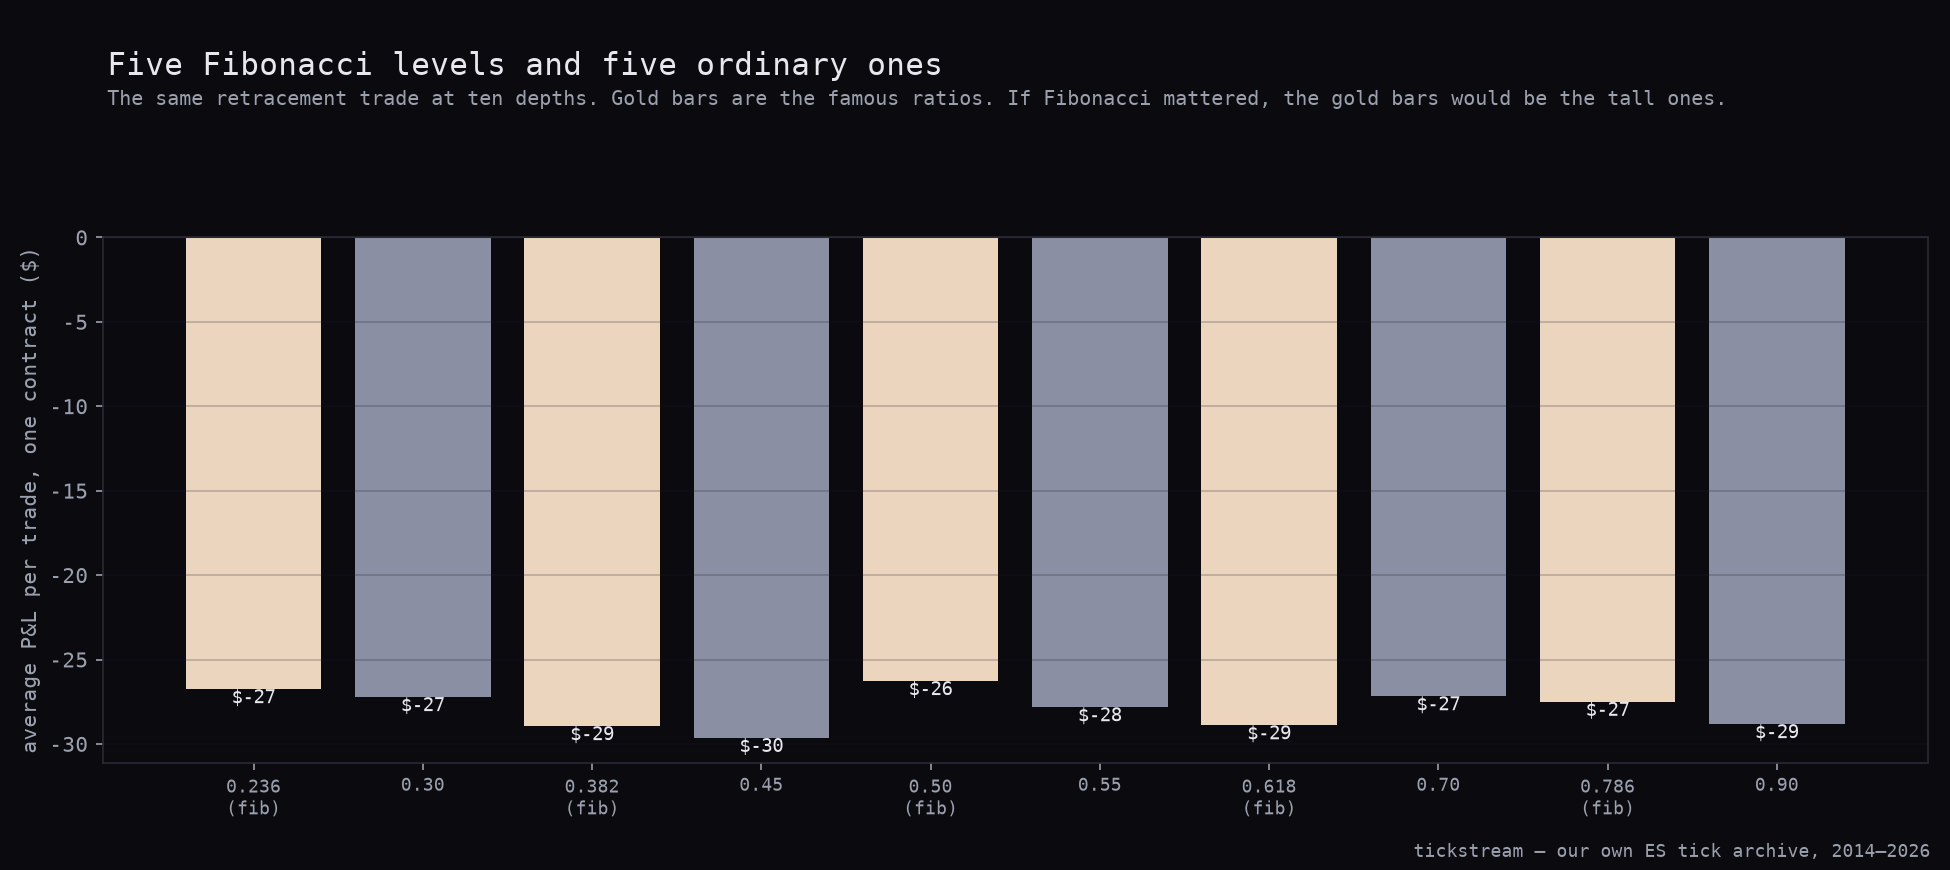
Pooled, the five Fibonacci ratios average −$27.66 a trade and the five ordinary ones −$28.12. That is a difference of $0.46 in Fibonacci’s favour, at t = 0.64 and p = 0.5406. Forty-six cents, on a contract where the round trip costs $29.50.
The best depth in the table is 0.50. It is Fibonacci only by courtesy: it is a half, it appears on every retracement tool ever built, and it has nothing to do with the sequence. The two ratios the sequence actually produces, 0.382 and 0.618, are the fourth-worst and third-worst rows.
We reached the same verdict dissecting ICT’s OTE zone on NQ and again when we mechanized a key-opens-plus-Fibonacci strategy from a video. This run confirms it on five more years of data and a different index. Whatever a retracement trade is doing — and buying pullbacks in a trend does something, we have measured that elsewhere — the Fibonacci ratio is not the part doing it.
The rejection block loses, and its placebo loses by less than a tick
The last family is the rejection block: a bar whose wick pushes into a level and gets refused, traded when price comes back.
| Trades | Win rate | Average | Total | PF | t | Exits | |
|---|---|---|---|---|---|---|---|
| Real block | 23,125 | 36.2% | −$22.11 | −$511,210.71 | 0.818 | −11.28 | 14,584 stop, 8,137 target, 404 timeout |
| Placebo level | 20,143 | 34.5% | −$28.10 | −$565,995.09 | 0.769 | −13.47 | 13,108 stop, 6,754 target, 281 timeout |
The real setup loses $511,210.71 over 23,125 trades at a profit factor of 0.818. It hits its stop 14,584 times against 8,137 targets, which on a two-to-one bracket is close to the ratio a coin flip produces.
The placebo takes the same revisit trade at a price the wick never marked and loses $28.10 a trade. The block beats it by $5.99. One ES tick is $12.50, so the entire advantage of trading a genuine rejection wick over an arbitrary nearby price is under half the smallest increment the market quotes — and both sides of the comparison are losing.
One convention makes this run trustworthy, and it is worth saying plainly because we got it wrong before. Our NQ rejection-block study printed +$85,000 and was really −$65,000. The entry and the target resolved inside the same five-minute bar, so the simulator handed the trade a fill it could not have had. Here the bar that reaches the level and the bar that manages the trade are never the same bar. Nothing in this test lets an entry bar produce its own exit.
That correction costs the strategy $150,000 of imaginary profit and is the reason the table above is worth printing at all.
What we changed
Nothing in the book. There was nothing here to add, and there was nothing to remove either, because we never traded any of the three.
What did change is the standard. This is the fourth article in the ES series where the control turned out to be the finding rather than the signal. The pivot and Camarilla test showed a mirrored control inventing a 24.2-point edge out of the S&P’s up/down asymmetry. The 80% rule showed the same mirror turning a null into 21.2 points. Now the key opens show a control that was broken in the opposite direction, one that handed the level a twenty-point edge our own first draft nearly published.
The pattern across all three families in this article is the same sentence. Each names a price and claims the market cares about it. In each case, once the comparison price is chosen so that only the name differs, the effect goes to zero or reverses. Twelve and a half years of ES is long enough that none of these can hide behind a small sample — the fib table alone is 84,839 trades at its widest — so the null is not a failure to detect. It is a measurement.
Data: tickstream ES tick archive, 2014-01-02 to 2026-09-10, twelve and a half years — five years longer than the NQ archive our earlier level work used. Key opens on one-minute bars: opening print of the first minute at or after each target time, revisit measured over a 240-minute forward window, control anchor drawn from a uniformly random earlier index of the same session with an identical 240-minute window, significance from Welch two-sample t-tests on the revisit indicators. Fibonacci and rejection blocks on five-minute bars: 24-bar swing, 50-period EMA for direction, 14-period ATR for the bracket, one ATR stop, two ATR target, 48-bar maximum hold, one position at a time. Rejection wick threshold 60% of bar range. Entry bar and exit bar are always distinct. Several wicks can be waiting at once, so fills are resolved chronologically across all live levels — first touch takes the book, ties broken toward the level nearest the bar’s open — rather than by scanning each level’s own future, which is a selection only the future can make and which cost two other results in this series. Costs $29.50 a round trip on one ES contract — $4.50 commission plus two ticks at $12.50. Trade P&L significance from one-sample t-tests; the Fibonacci-versus-ordinary comparison is a two-sample t-test on the ten per-ratio averages.
Frequently asked questions
Is the 09:30 New York open a magnet on the S&P 500?
It is the opposite. Across 3,778 ES sessions, price came back to the 09:30 open within the next 240 minutes on 88.2% of them, while a randomly chosen minute of the same session — given the identical 240-minute window — was revisited on 97.3%. That is an edge of −9.1 percentage points at t = −15.49. All four key opens we tested run the same direction.
Why do key opens look like magnets in most tests?
Because the usual question is 'does price revisit the open', and at 09:31 you are still standing on it. Our own first attempt compared the open against a random earlier price in the same session and produced edges of twenty-odd points with t-statistics above 20. An earlier price is further away and has less session left to be reached in, so the open wins on geometry alone. We threw that run out.
Do Fibonacci retracement levels beat ordinary ones on ES?
No. We ran the identical retracement trade at ten depths, five Fibonacci and five arbitrary. The five Fibonacci ratios averaged −$27.66 a trade and the five ordinary ones −$28.12, a difference of $0.46 with t = 0.64 and p = 0.5406. The best depth in the table is 0.50, which is a half.
Does the rejection block work on the S&P 500?
No. Entering on the revisit of a rejection wick produced 23,125 trades and lost $511,210.71 on one contract after costs, at −$22.11 a trade and a profit factor of 0.818. The same revisit trade at a price the wick never marked lost $28.10 a trade. The gap between them is $5.99, under half of one ES tick at $12.50.
How is this test protected against the same-bar fill trap?
Our earlier NQ rejection-block study printed +$85,000 and was really −$65,000, because the entry and the target resolved inside the same bar. In this run the level touch and the trade are separate bars: the bar that reaches the level cannot also produce the exit. That single convention is the difference between a headline and a $150,000 error.