Session Entropy Forecasts S&P Volatility and Still Loses to Yesterday's Volatility
Shannon entropy of a session's minute returns correlates +0.3385 with the next session's realised volatility on 3,078 ES cash days, with p rounding to zero. Yesterday's realised volatility scores +0.7849 on the same target and costs nothing to compute. Once that free benchmark is removed, entropy retains a partial correlation of +0.0641 — real at p = 0.000373, and far too small to size a position on. Against direction it retains +0.0217 with p = 0.2281, which is nothing at all.
Shannon entropy of a session’s minute returns correlates +0.3385 with the next session’s realised volatility, measured on 3,078 ES cash sessions. That is a real number and it survives every check we threw at it. It also loses, badly, to yesterday’s realised volatility at +0.7849 — a benchmark that requires no tick data, no binning and no code beyond a subtraction.
This is the second time we have tested the entropy pitch. The first version used a rolling window on daily bars and found no forward information at all. This one uses each session’s own intraday distribution, which is the fairer construction, and it does find forward information. The verdict is the same anyway, for a different and more useful reason.
The rule
No trades here. This is an information test, and it is short enough to reimplement.
- Take every ES cash session with at least 300 minute bars, 09:30 to 15:55 New York.
- Compute minute-to-minute percentage returns of the close within that session.
- Bin them into eight quantile buckets of that same session, drop empty buckets, and take the Shannon entropy of the resulting probabilities. A session where the minute returns spread evenly across all eight buckets scores high; one where they pile into two or three scores low.
- Define the session’s realised volatility as the standard deviation of those minute returns, annualised over 390 bars.
- Correlate today’s entropy against tomorrow’s realised volatility. Never against today’s — that is a description, not a forecast.
- Run the same correlation for yesterday’s realised volatility against tomorrow’s, as the benchmark.
- Then remove yesterday’s realised volatility from both entropy and tomorrow’s volatility by linear regression, and correlate the residuals. That last step is the whole article.
The number that looks good, and is
Entropy is not noise. On the next session’s realised volatility it scores +0.3385, and on the next session’s absolute open-to-close move it scores +0.3309. Both p-values round to zero on 3,078 sessions. A high-entropy session — minute returns spread widely rather than clustered — is genuinely followed by a more volatile day more often than not.
We want to be clear about this before we take it apart. Most indicator folklore we test in this series fails at this stage, with a correlation in the third decimal place and a sign that flips between adjacent parameter cells. Entropy does not fail here. It measures something, it measures it consistently, and 0.33 on three thousand independent sessions is not an accident.
The number it has to beat, which is free
| Predictor of the next session | Target | r | p | n |
|---|---|---|---|---|
| Entropy | realised volatility | +0.3385 | 0.0 | 3,078 |
| Entropy | absolute move | +0.3309 | 0.0 | 3,078 |
| Yesterday’s realised volatility | realised volatility | +0.7849 | 0.0 | 3,078 |
| Yesterday’s range | range | +0.7250 | 0.0 | 3,078 |
Yesterday’s volatility predicts tomorrow’s more than twice as well as entropy does. Yesterday’s range predicts tomorrow’s range at +0.7250, on nothing more than a high minus a low.
This is the point of the article, and it generalises past entropy. An indicator does not have to be useless to be worthless. It has to beat the free thing. A correlation of +0.3385 sounds like a discovery until it is placed next to a column that was already sitting in the same dataframe, uncomputed and unpriced.
What is left when the free thing is removed
Regress yesterday’s realised volatility out of both sides and correlate what remains. Entropy keeps a partial correlation of +0.0641, with p = 0.000373 on 3,078 sessions.
Both halves of that sentence matter. The p-value is not marginal, and we are not going to call 0.0641 zero — it is a small, real, repeatable increment of information that entropy holds and yesterday’s volatility does not. It is also 0.0641. An edge of that size is inside the width of ordinary estimation error on a three-thousand-day sample. Anything built on it would still have to clear $29.50 a round trip on one ES contract before a cent of it reached the account. Nobody can size a position on it. Both things are true at once and the honest version of this result says both.
What entropy knows about direction
Nothing. Controlled the same way, entropy’s partial correlation with the session’s direction is +0.0217, at p = 0.2281. That is the first p-value in this test that does not clear any threshold at all.
There is a reason it was never going to work, and it is visible without touching entropy:
| ES daily quantity | Lag-1 autocorrelation |
|---|---|
| Realised volatility | +0.785 |
| Range | +0.725 |
| Range, lag 5 | +0.548 |
| Direction | −0.011 |
Volatility is one of the most persistent quantities in markets. Direction, on this instrument at daily resolution, has no memory whatsoever — the lag-one autocorrelation is −0.011, and the range still carries +0.548 five sessions out. There is simply nothing for a direction predictor to latch onto.
That asymmetry explains a large share of the indicator business. Any indicator that appears to “work” on a daily bar is almost always a volatility indicator in disguise, because volatility is the only thing on the chart with enough persistence to be forecast. Entropy is a clean example. It looked like a market-state signal, and most of what it forecasts was already in yesterday’s standard deviation. Not all of it, though: the partial correlation of +0.0641 says entropy holds a little of its own, so this is an overlap rather than a copy.
The chart
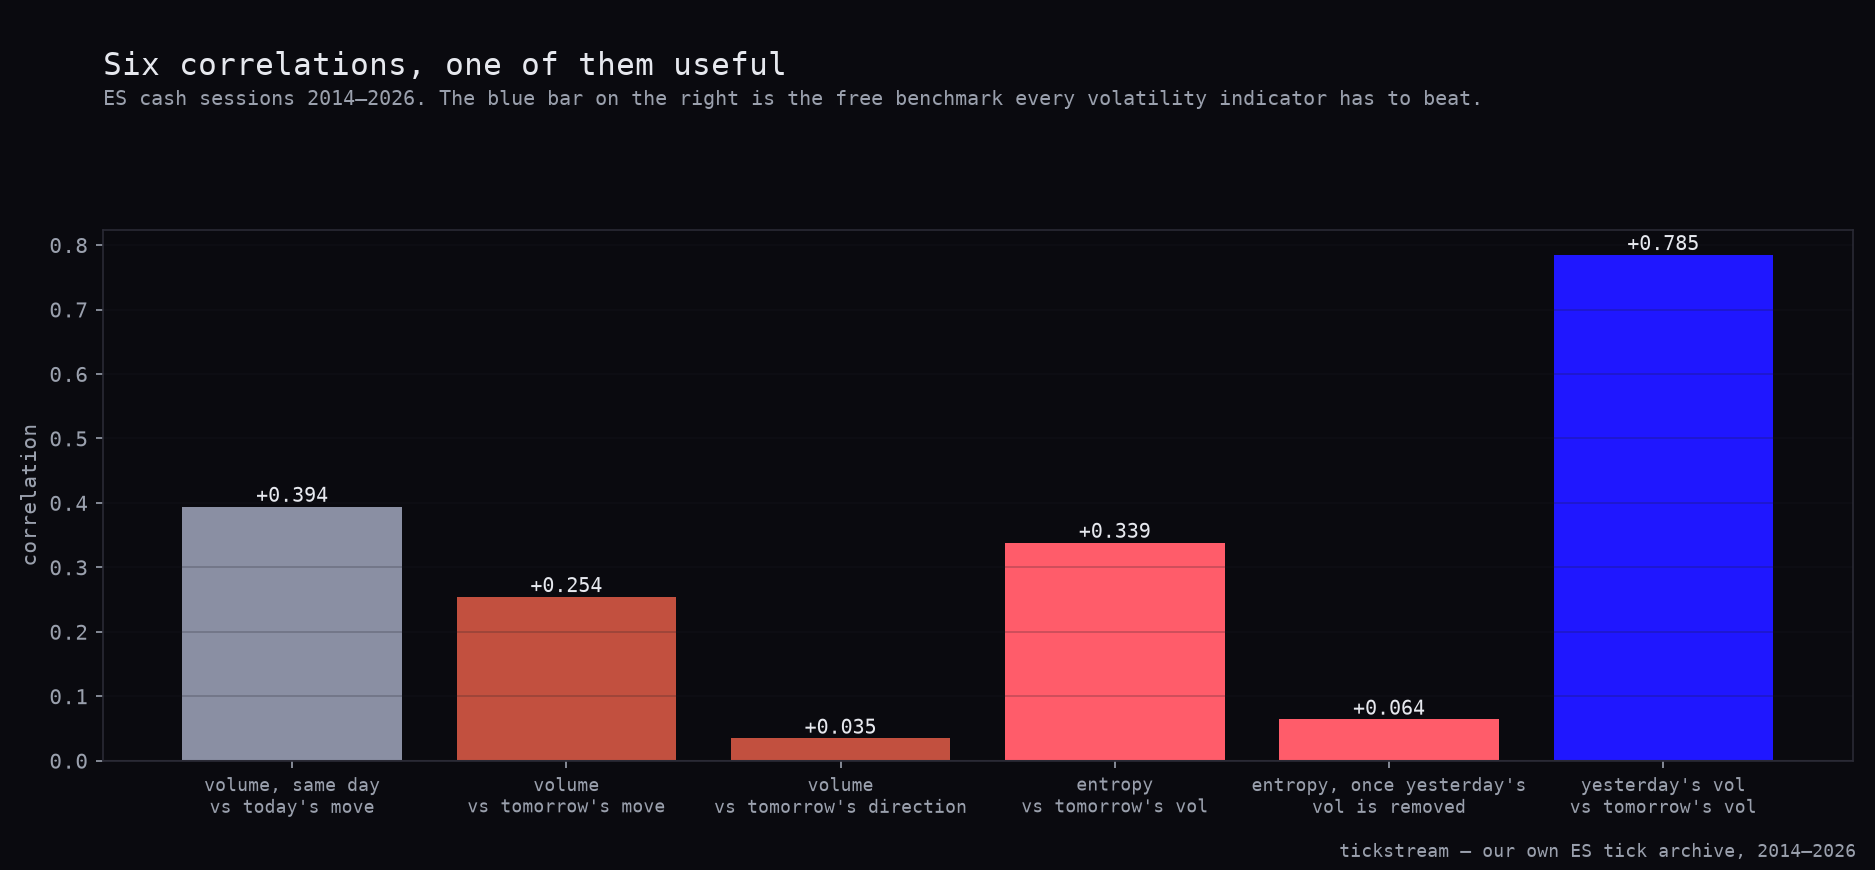
Six correlations, plotted on the same axis so the comparison cannot be avoided. The three we are using here are the entropy bar at +0.339, the entropy bar with yesterday’s volatility removed at +0.064, and the blue benchmark on the right at +0.785. The three left-hand bars are volume tests and belong to the companion article on volume, which asks the same question of a different indicator.
A working rule, because this keeps happening
This is the second test in the ES series where a large raw correlation collapsed once the obvious confound was partialled out. It happened with large-trade flow at range breakouts, where 55.3% agreement with breakout direction was mostly the geometry of where the base closed. It happens here. The value-area magnet went the same way without a correlation in it: there a second control disagreed with the first, and the level’s 21.2-percentage-point edge went with it.
So we are writing it down as a standing rule rather than rediscovering it a fourth time:
- Any claimed predictor of volatility is reported alongside yesterday’s volatility, in the same table, on the same sample.
- Any claimed predictor of direction is reported alongside a placebo.
- Neither control is optional, and neither is a footnote. If only the raw correlation is quoted, the second test was not run.
It is not a clever rule. It costs one extra column and it would have saved us three separate write-ups.
What we changed
Nothing in the book. There was never an entropy sleeve and there will not be one at +0.0641.
One thing did change in the research pipeline: we now keep a session-entropy column in the daily feature set alongside range, realised volatility and volume. It is cheap to compute from data we already store, it is not a duplicate of yesterday’s volatility, and inside a larger model it may yet earn its 0.0641. That is the extent of the claim. It is a column we are keeping, not a signal we are trading.
The archive this ran on is for sale: ES ticks back to 2014, from which every minute bar and every session here was built, in the historical data packages.
Methodology: ES minute bars built from our own tick archive, 4 February 2014 to 8 September 2026, 3,078 cash sessions of at least 300 bars each, 09:30–15:55 New York. Entropy is the Shannon entropy of that session’s minute close-to-close returns binned into eight quantile buckets, empty buckets dropped. Realised volatility is the standard deviation of those returns annualised over 390 bars; range is session high minus session low. Partial correlations remove yesterday’s realised volatility from both variables by ordinary least squares before correlating residuals. Pearson throughout, two-sided p. No trades were simulated; where cost is mentioned it is the series standard of $4.50 commission plus two ticks per round trip, $29.50 on one ES contract.
Frequently asked questions
Does market entropy actually predict volatility on the S&P?
Yes, and we are not going to pretend otherwise. Shannon entropy of a session's minute returns correlates +0.3385 with the next session's realised volatility across 3,078 ES cash sessions, and +0.3309 with the next session's absolute open-to-close move. Both carry p rounding to zero. That is a genuine relationship, not noise.
Then why do you say it is not worth trading?
Because the thing it has to beat is free. Yesterday's realised volatility correlates +0.7849 with tomorrow's, more than twice entropy's +0.3385, and it needs no tick data, no binning and no library. An indicator does not have to be useless to be worthless — it has to add something on top of the number you already had.
Does anything survive once yesterday's volatility is controlled for?
A little. Removing yesterday's realised volatility from both sides leaves entropy with a partial correlation of +0.0641 against the next session's volatility, at p = 0.000373 on 3,078 sessions. That is statistically real and we will not round it to zero. It is also 0.064, which after $29.50 of round-trip cost and ordinary estimation error is not a position size.
Can entropy tell you which way the market goes?
No. Controlled for yesterday's volatility, entropy's partial correlation with the session's direction is +0.0217 with p = 0.2281. There is also nothing there to find: the lag-one autocorrelation of ES daily direction is −0.011, against +0.725 for the daily range. Direction has no memory on this instrument, and volatility has a great deal of it.
What is the general rule you took from this?
Every claimed volatility predictor now ships next to yesterday's volatility, and every claimed direction predictor ships next to a placebo. The reason is the size of the gap this test found: a headline of +0.3385 collapsed to +0.0641 once one free column was subtracted. If a vendor quotes the raw correlation and not the partial, they have not run the second test.