Three Market-Profile Claims Die at the Descriptive Stage on 3,098 ES Sessions
Open location, P/b/D day shapes and four-week composite profiles all promise to tell you what the next session will do. On 3,098 ES sessions the directional efficiency of the day is 0.473 when price opens above value, 0.467 below and 0.463 inside, against 0.468 for every session. Trading the rule lost $38.84 a trade over 1,817 trades, and inverting it lost $20.16. None of the three composite levels beat an equally distant price on the other side of the open.
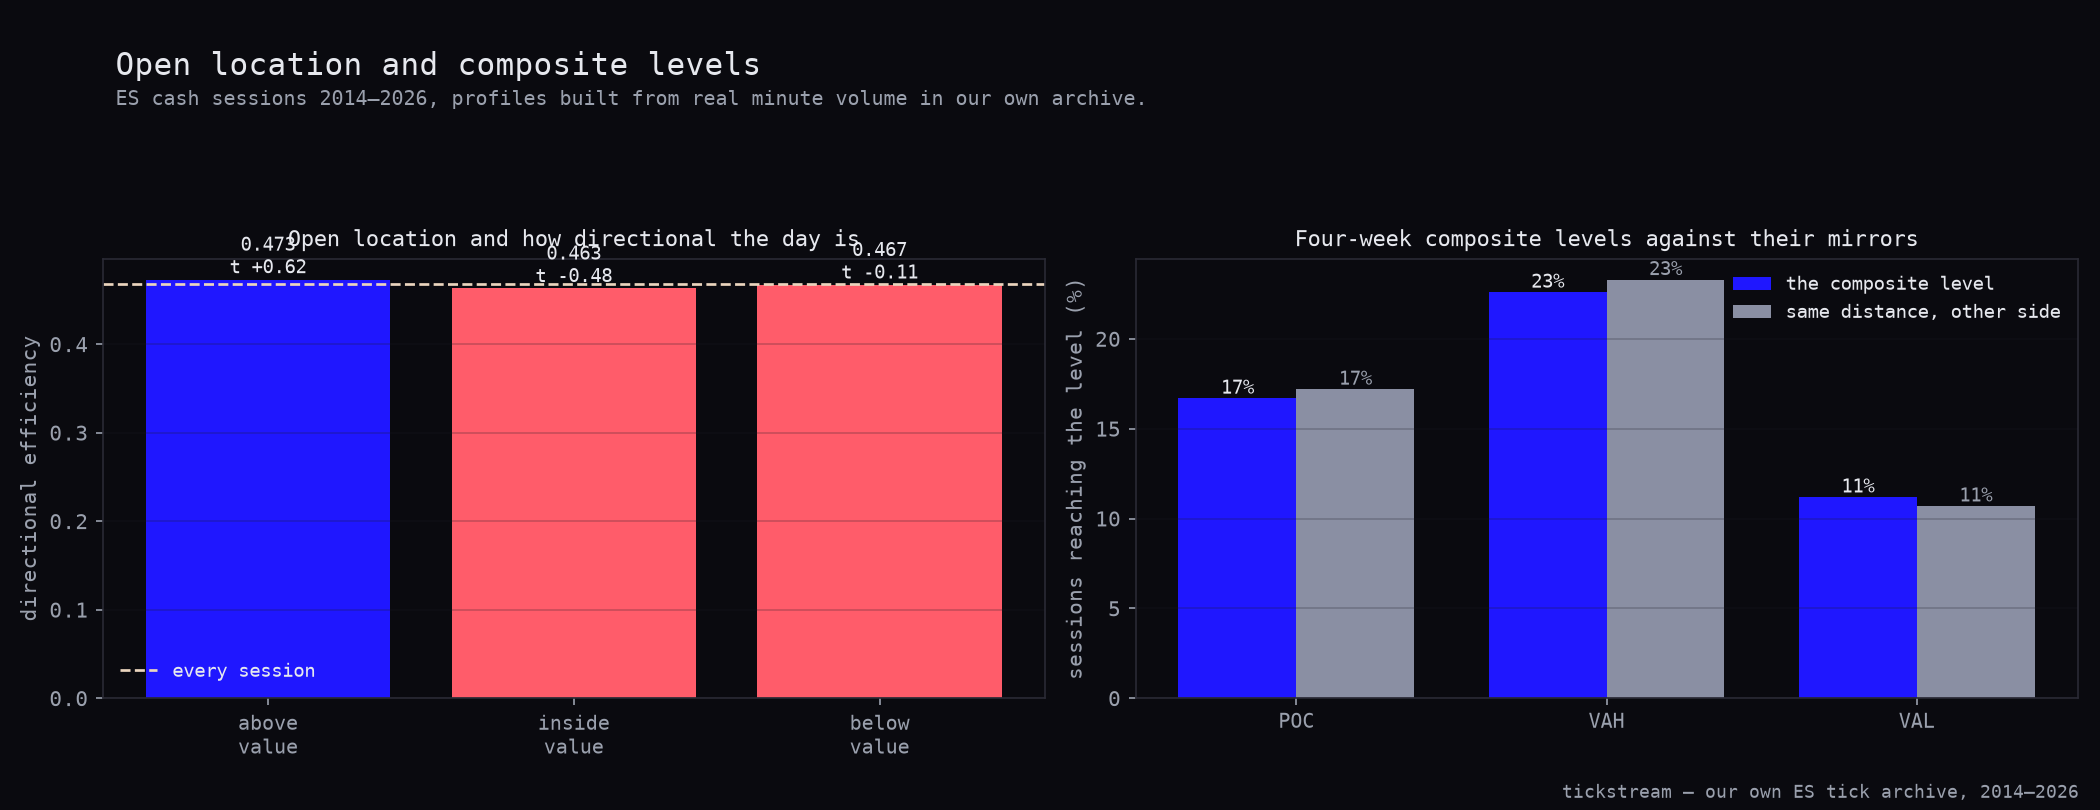
Directional efficiency on ES is 0.473 when the session opens above the prior value area, 0.467 when it opens below and 0.463 when it opens inside. Every session averages 0.468. That is the whole open-location claim, measured on 3,098 S&P sessions, and it is over before a single trade is simulated.
We tested three claims from the same school in one pass: open location, P/b/D day shapes, and farming a four-week composite profile. Each one was checked descriptively first, because a rule whose premise is false cannot be rescued by a better stop. All three failed that check, and the traded versions failed afterwards for the ordinary reason.
The three rules
- Open location. Build the prior regular session’s volume profile at one-point resolution. The value area is the smallest set of buckets holding 70% of that session’s volume. If today opens above VAH or below VAL, expect a trend day. If it opens inside, expect rotation.
- Day shapes. Classify each session by where the volume mass sits inside its own profile range. Mass in the upper third is a P, in the lower third a b, in the middle a D. P means short covering and continuation, b means long liquidation, D means balance.
- Composite farming. Build a profile from the last twenty sessions at two-point resolution and treat its POC, VAH and VAL as levels the next session is drawn towards.
- The measure for claim one is directional efficiency: the absolute distance from open to close divided by the session’s full range. A day that opens at one extreme and closes at the other scores 1.0. A day that ends where it started scores 0.
- The control for claim three is the mirror: the same distance from the open, on the other side.
Open location sorts nothing
The buckets are not close to each other by accident of rounding. They are close because open location carries no information about how directional the day will be.
| Open location | Sessions | Directional efficiency | t | p | Avg move | Close above open | Avg range |
|---|---|---|---|---|---|---|---|
| Above value | 1,100 | 0.473 | 0.62 | 0.5364 | +0.52 pts | 54.7% | 34.78 pts |
| Below value | 717 | 0.467 | −0.11 | 0.9141 | +1.26 pts | 54.1% | 44.00 pts |
| Inside value | 1,280 | 0.463 | −0.48 | 0.6293 | +0.10 pts | 52.3% | 43.37 pts |
| Every session | 3,098 | 0.468 | — | — | — | — | — |
One thing does differ, and it is not the thing the rule is about. Sessions that open below value have a 44.00-point average range against 34.78 for those that open above. Opening below value is a volatility signal, which is unsurprising — the S&P gaps down when something has happened. It is not a directionality signal, and the rule is sold as a directionality signal.
The chart puts the three efficiency bars against the all-sessions line on the left. The right panel is the composite-profile test further down, each level next to its mirror. On the left, look at how little daylight there is between the bars and the dashed line.
Our NQ test of this framework found open location failing at the descriptive stage too, with the behaviour running opposite to the rule. On the S&P it does not run opposite. It just does not run. That is a different kind of null and worth naming: the Nasdaq result gave you something to invert, and this one gives you nothing at all.
The traded version, and its inversion
We ran the rule anyway, in its simplest form. Open outside value, go with the open, exit at the close. One contract, one trade per session.
| Go with the open | Inverted | |
|---|---|---|
| Trades | 1,817 | 1,817 |
| Win rate | 49.6% | 46.6% |
| Average | −$38.84 | −$20.16 |
| Median | −$4.50 | −$54.50 |
| Total | −$70,576.50 | −$36,626.50 |
| Profit factor | 0.923 | 0.960 |
| Max drawdown | $107,575.50 | $76,459.50 |
| Best trade | $9,145.50 | $10,270.50 |
| Worst trade | −$10,329.50 | −$9,204.50 |
| Sharpe | −0.32 | −0.16 |
| t | −1.12 | −0.58 |
| p | 0.2617 | 0.5602 |
Both directions lose. That is the correct outcome for a rule with no signal in it and a $29.50 round trip attached.
It is also where we caught a bug in our own first draft of this test, and the bug is common enough to be worth the paragraph. Negating the P&L of a losing strategy is not a test of the opposite strategy. The recorded P&L already has costs subtracted, so flipping its sign flips the costs too, and the $29.50 you paid becomes $29.50 you earned. The inverted rule has to be simulated as its own trade paying its own round trip.
The size of that error here is exactly two round trips per trade, $59.00. Negating our real result of −$38.84 a trade would have printed +$38.84, and the honest inverted run is −$20.16. The first number is not a finding, it is the commission read backwards. We ran the second one.
Day shapes describe today and say nothing about tomorrow
P days average +14.41 points and b days −18.19. Both figures are definitionally true. A profile with its volume mass high finished high, and that is what “P” means. The number tells you nothing you did not already have from the close.
The forward test is the one that matters.
| Prior day shape | Sessions | That day’s move | Next day up | Next day avg | p vs 50% |
|---|---|---|---|---|---|
| P | 1,157 | +14.41 pts | 54.0% | +0.64 pts | 0.0068 |
| D | 1,133 | −0.35 pts | 54.2% | −0.13 pts | 0.0057 |
| b | 807 | −18.19 pts | 52.2% | +1.26 pts | 0.2313 |
| All sessions | 3,098 | — | 53.6% | — | — |
Those p-values look decisive and they are answering the wrong question. They are tests against 50%, not against the base rate. The S&P closes up 53.6% of all sessions in this window, so a 54.0% reading after a P day is worth four tenths of a percentage point, and a 54.2% reading after a D day is worth six tenths. Against 50% they clear p = 0.01 comfortably. Against 53.6% they say nothing.
This is the single most common way a calendar or classification claim gets published. Pick a subset of days, count how often the market goes up, test the count against a coin flip, and report the p-value. Equity index futures drift upward, so almost any subset large enough to be significant will clear that test. The b-day bucket makes the point from the other side: at 52.2% it sits below the unconditional rate, and at p = 0.2313 it is the only one of the three that fails even the wrong test.
The right null for “does this classification predict tomorrow” is the unconditional rate over the same window. Nothing here beats it.
Composite levels lose to their own mirrors
Twenty sessions of volume, profiled at two points. Does the next session reach the composite POC, VAH or VAL more often than it reaches an equally distant price on the other side of the open?
| Level | Sessions | Reached | Mirror | Edge | t | p | Median distance |
|---|---|---|---|---|---|---|---|
| Composite POC | 2,991 | 16.7% | 17.2% | −0.5pp | −0.52 | 0.6054 | 47.50 pts |
| Composite VAH | 2,913 | 22.6% | 23.3% | −0.8pp | −0.72 | 0.4737 | 31.25 pts |
| Composite VAL | 3,045 | 11.2% | 10.7% | +0.6pp | 0.70 | 0.4855 | 90.25 pts |
None of the three beats its mirror. Two are behind it. The one that is marginally ahead, VAL at +0.6 percentage points, is at t = 0.70 on 3,045 observations.
The VAL row also explains itself. It is reached on 11.2% of sessions because on a median day it sits 90.25 points away, and ES does not cover 90 points from the open on most days. A twenty-session composite in an index that trends upward puts its value low a long way below where price now is. That is arithmetic about the drift, not evidence about the level.
The mirror is a fair control in this test, and we want to be explicit about why, because in our ES value-area article the same control was broken. There, the setup required price to have re-entered the value area first, so the session was already moving in the target’s direction when the clock started, and the mirror pointed against a move already underway. That contamination was worth 21.2 percentage points. Here nothing conditions on a prior move. The composite levels sit on both sides of the open, and the mirror differs from the tested level in one way only: the price. The numbers above are honest.
What we changed
Nothing in the live book, because none of these were in it. Two things went into the process instead.
The first is the inversion rule, written down: an inverted strategy is a new simulation, not a sign flip. We had that bug in the first run of this file and it made a losing rule look like a $38.84-a-trade winner in the direction nobody trades.
The second is the base-rate rule. Any test that reports “up X% of the time” now reports the unconditional rate for the same window on the same line. On this data that is 53.6%, and it is the difference between a P-day claim that clears p = 0.0068 and a P-day claim that is worth four tenths of a point.
What the profile is genuinely good for is what it was built for: it is an accurate description of where trading happened. The POC really is the price that traded most. The value area really does hold 70% of the volume. All three claims tested here take that description and turn it into a prediction, and none of the three survives the crossing.
Our NQ P/b/D test and NQ 80%-rule test reached the same verdict on seven years of Nasdaq data. The extra five years of S&P history did not rescue any of it. The archive this ran on is for sale in the historical data packages.
Data: tickstream ES tick archive, 3,098 regular sessions, 2014-01-03 to 2026-09-09, sessions with more than 300 minute bars. Session 09:30–16:00 New York, one-minute bars built from our own ticks. Daily profiles at one-point resolution, four-week composites at two points, both from real minute volume; the value area is the smallest set of buckets holding 70% of the profile’s volume. Shape classification by the POC’s position in the profile range: above 0.65 is P, below 0.35 is b, otherwise D. Composite levels closer than 2 points to the open are dropped. Directional efficiency is |close − open| divided by the session range. Costs $29.50 a round trip on one ES contract — $4.50 commission plus two ticks at $12.50 — charged to every simulated trade including the inverted one. Significance from Welch two-sample t-tests on efficiency and hit rates, an exact binomial against 50% on the next-day counts, and a one-sample t-test on trade P&L.
Frequently asked questions
Does opening outside the prior day's value area produce a trend day on the S&P?
No. Directional efficiency — the share of the session's range the close captured from the open — was 0.473 on the 1,100 sessions that opened above value and 0.463 on the 1,280 that opened inside. Every session averages 0.468. The three buckets sit within one hundredth of each other, at t = 0.62 and t = −0.48.
Is the open-location rule tradeable if you just go with the open?
It lost money. Going with the open on all 1,817 sessions that opened outside value and exiting at the close produced a 49.6% win rate, −$38.84 a trade and −$70,576.50 in total, at a profit factor of 0.923.
Does the opposite rule work, then?
No, and this is where most inversion tests cheat. Run as its own trade paying its own $29.50 round trip, the inverted rule lost $20.16 a trade and $36,626.50 in total, at t = −0.58. Both directions lose because the costs are real in both.
Do P, b and D day shapes predict the next session?
Not against the right benchmark. After a P day the next session closes up 54.0% of the time and after a D day 54.2%, but the unconditional base rate across all sessions is 53.6%. The b-day reading of 52.2% is below the base rate and not significant at p = 0.2313.
Are four-week composite profile levels magnets?
No. The composite POC was reached on 16.7% of sessions against 17.2% for an equally distant price on the other side, an edge of −0.5 percentage points. VAH came in at 22.6% against 23.3%, and VAL at 11.2% against 10.7% from a median distance of 90.25 points.