We Combined GEX, Volume Profile, Order Flow & ORB. The Backtest Made $500k. It Was Fake.
The dream stack: gamma levels + volume-profile nodes + order-flow confirmation + opening-range breakout, all confluencing into one strategy. We built it on 7 years of NQ tick data with real GEX levels back to 2019. The naive backtest printed half a million dollars per contract at t=8. Then we noticed both long AND short 'won' the same $400k — the signature of a fill artifact. With honest fills it collapses 90%. Here's the full autopsy: levels are base-rate, order-flow confirmation doesn't rescue them, and a shuffled fake GEX regime scores as high as the real one.
Every trader eventually imagines the same strategy. Dealer gamma levels mark where price should pin or accelerate. Volume-profile nodes mark where the market agreed on value. Order flow confirms whether buyers or sellers are really there. And an opening-range breakout gives you the trigger. Stack them — only trade where they confluence — and surely the edge falls out.
A reader asked us to actually build it. So we did, properly, on 7 years of NQ tick data — with real historical GEX levels reconstructed back to 2019 (call wall, put wall, zero-gamma flip, mapped from the QQQ option surface onto NQ, set each day from the prior session’s close so there’s no lookahead), the volume-profile levels from our composite-profile store, cumulative delta from the real tape for order-flow confirmation, and honest fills throughout. One stat judges everything: t — how far the average day sits from zero relative to its own noise; |t| > 2 is real.
The backtest made half a million dollars
Here’s the naive combined strategy — trade the confluence, favorable bracket, entry on the breakout trigger:
+$505,000 per contract. t = 8.4. Every year green.
We could have stopped there, screenshotted the equity curve, and sold a course. Instead we ran the check that every backtest owes you.
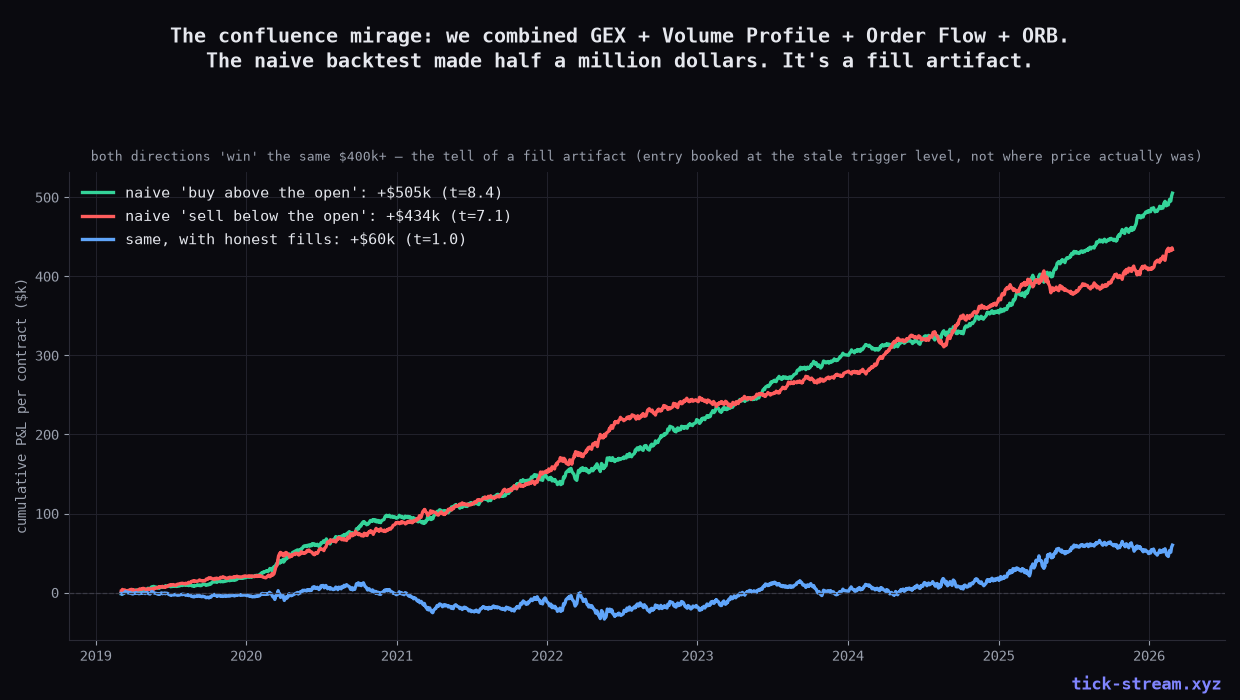
Both directions “won.” That’s impossible.
The green line is buying above the open on the confluence signal. The red line is selling below it — the opposite trade, same days. It also makes $434,000, t = 7.1. Buying and selling the same market on the same days cannot both be edges. When both directions print the same fortune, you are not measuring signal — you are measuring fill geometry.
The bug was subtle and it’s one of the most common in retail backtesting: the entry was booked at the trigger level after price had already traded through it — a fictitious, favorable fill you’d never get live. Fill the entry at where price actually was that minute (the bar’s close) and the blue line is what you get: +$60k, t = 1.0 — a 90% collapse into noise. The half-million was the artifact.
That’s the headline. But the more useful part is why no amount of confluence saved it — so we took every layer apart.
Layer 1: the levels don’t hold
First touch of each level in the session, across 7 years, measured against a placebo — a random price the same distance from the open:
| Level | ”held” rate | vs base rate | verdict |
|---|---|---|---|
| GEX call wall | ~46% | ≈ base | price continues through, doesn’t reject |
| GEX put wall | ~48–51% | ≈ base | noise |
| Gamma flip | ~53–55% | +3pt (t≈1.2) | weak pivot, sub-significant |
| Volume POC | 48% | ≈ base | nothing |
| Volume VAH/VAL | 48–51% | ≈ base | nothing |
| Volume HVN | 47–52% | ≈ base | nothing |
Not one level reacts beyond what a random price does. The call wall actually “holds” less than half the time — price runs through it more often than it rejects. The single flicker is the zero-gamma flip as a weak mean-reversion pivot, and even that is t≈1.2 — real in sign, untradeable in size. This is the same result we’ve now measured on volume profile, value area, HVN reaction levels and two full order-flow books: the edge lives away from levels, not at them.
Layer 2: order flow doesn’t rescue them
The reader’s specific idea was to fade a level only when order flow confirms — price makes the extreme but cumulative delta diverges. This is the heart of the “levels + confirmation” school, so we tested it exactly.
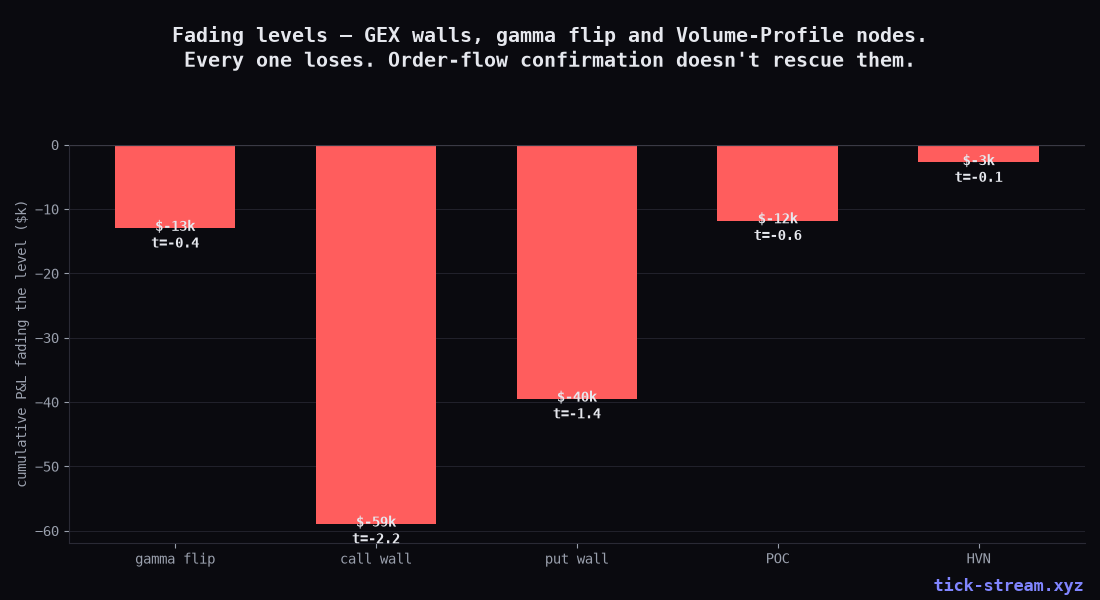
Every level fade loses money on its own. Adding the delta-divergence filter made it worse, not better — the call-wall fade went from t = −2.2 to t = −3.4 once “confirmed.” A couple of level types flipped mildly positive after confirmation, but only on 30–70 trades and with no consistency across level types — the fingerprint of small-sample luck, not a filter. Confirmation shrinks your sample and adds no direction. (We found the same thing testing CVD, delta and footprint directly: order flow’s honest use is execution, not entry signals.)
Layer 3: the GEX regime adds nothing
The best hope was the regime — not the levels, but the sign of net gamma. Negative-gamma days should trend (dealers hedge with the move); positive-gamma days should pin. And the raw character split is real but weak: the most-negative-gamma quintile leans to intraday continuation (59% vs 52%), positive-gamma days to mean reversion.
So we gated real strategies by regime — and compared to a shuffled regime, where we randomly reassign the pos/neg labels to days. If the regime carries information, the real labels must beat the fake ones.
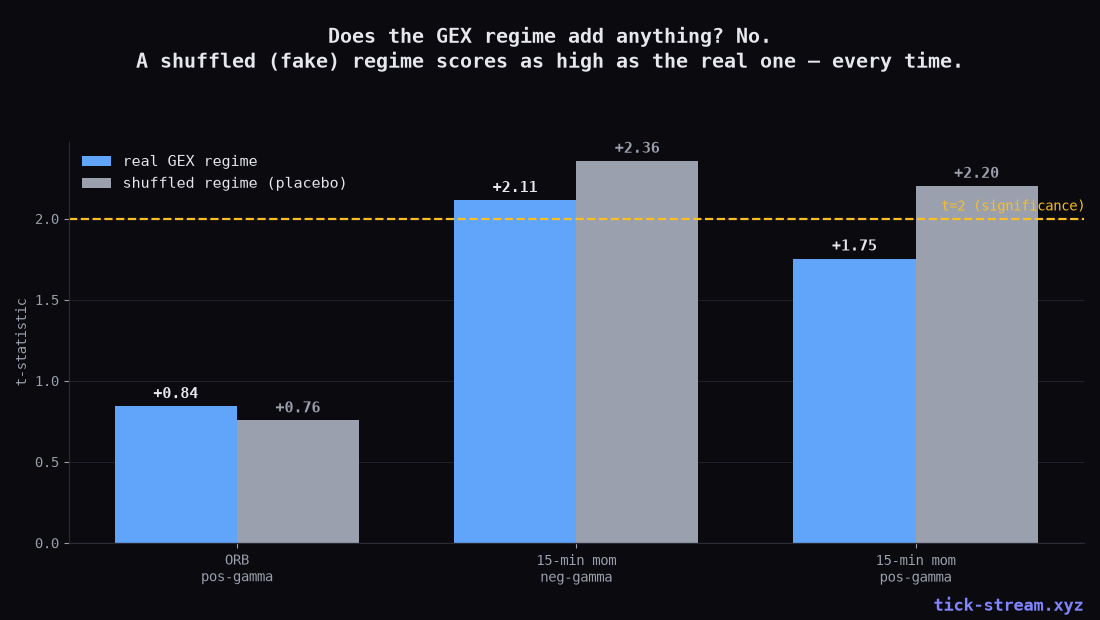
The shuffle scores as high or higher, every time. Opening-range breakout gated by positive gamma: real t = 0.84, shuffled t = 0.76 — a wash. 15-minute momentum gated by negative gamma: real t = 2.11, shuffled t = 2.36 — the fake regime wins. The regime label was decoration on a momentum effect that was already there. (This isn’t a knock on gamma regime in general — a narrow, specific open-momentum construction does use it profitably; it’s our live Backdraft sleeve, disclosed as regime- and period-dependent. But the broad “gate everything by gamma” idea doesn’t survive a shuffle.)
What actually survives
Strip away the levels, the confirmation and the regime, and one thing is left standing: plain intraday momentum. First-15-minute direction held to the close was positive over the whole sample, t = 2.7. But it’s honest about what it is:
- A shuffled GEX regime captures it just as well — it’s not a gamma effect.
- On a train/holdout split it’s period-concentrated: 2019–mid-2023 was flat (t = 0.5); the recent trending years carried it (t = 2.5).
It’s directional drift that shows up in trending regimes — the same opening-drive / momentum effect we keep finding — not a confluence discovery. None of the four “confluence” ingredients improved it.
The lesson worth more than the strategy
Confluence feels like it should multiply edges. On weak or dead signals, it does the opposite: it multiplies your degrees of freedom to fool yourself. Four ingredients, three timeframes, two brackets, a handful of “confirmation” rules — somewhere in that space is a $500k equity curve, and it will be an artifact almost every time. The curve isn’t the proof; it’s the thing you have to disprove.
We sell GEX data — including a computed-GEX API and the free GEX tool thousands of people use. And here we are telling you the levels aren’t a signal. That’s not a contradiction; it’s the whole point. Gamma levels are genuinely useful context — where the market’s mechanical forces sit, which regime you’re in, where a move might run out of fuel. They are not entries, and anyone selling them to you as entries has either not run the placebo, or has run it and isn’t telling you. Use levels to understand the board. Get your edge from something that survives a shuffle.
Methodology: NQ front-month, 2019–2026. GEX levels reconstructed daily from the QQQ option surface (net gamma, call/put walls, zero-gamma flip), mapped to NQ via the prior-day close ratio, set from the prior session’s EOD (no lookahead); volume-profile levels from our composite store; cumulative delta from the real tick tape. Honest fills (stop entries at the entry-bar close, limit entries at the level on trade-through, stop-before-target), $14.50 RT + 1 tick slippage, daily-aggregated t-stats, placebos (random-price levels, shuffled regime), train/holdout split. All figures per single contract. Research, not advice; our live, disclosed track records are on /algos.
Frequently asked questions
Does combining GEX, Volume Profile and Order Flow create a trading edge?
Not in our testing on 7 years of NQ. We built the full confluence stack — dealer gamma levels (call wall, put wall, zero-gamma flip), volume-profile nodes (POC, VAH, VAL, HVN), order-flow confirmation via cumulative delta, and opening-range breakout — and tested every layer honestly. Individually the levels react at base rate, order-flow confirmation doesn't rescue them, and the GEX regime adds nothing a shuffled fake regime doesn't. The naive combined backtest looked spectacular (+$500k/contract, t=8) but was a fill artifact: with realistic fills it loses about 90% of that, landing at noise.
How do you know the $500k backtest was an artifact and not a real edge?
Two tells. First, the same construction 'won' roughly $400k+ whether we bought above the open OR sold below it — a real directional edge cannot make money in both directions on the same days. Second, the profit came from booking the entry at the trigger level after price had already traded through it, i.e. a fictitious favorable fill. When we filled entries at where price actually was that minute (the bar close), the edge collapsed from +$505k (t=8.4) to +$60k (t=1.0). Both checks point to fill geometry, not signal.
Do dealer gamma levels (call wall, put wall, gamma flip) work as support/resistance?
On first touch they react at base rate. Across 7 years, the call wall 'held' only ~46% of the time (price continued through more often than it reversed), the put wall ~48-51%, and volume-profile nodes 48-52% — all statistically indistinguishable from a random price the same distance from the open. The only mild exception was the zero-gamma flip acting as a weak mean-reversion pivot (~53-55% hold, t≈1.2), which is real in sign but far too weak to trade after costs.
Does order-flow confirmation improve level trades?
No. We faded each level only when cumulative delta diverged (price making the extreme while flow didn't confirm). Every level fade lost money without confirmation, and adding the delta filter generally made it worse, not better — the call-wall fade went from t=−2.2 to t=−3.4 once 'confirmed.' Where a confirmed variant flipped positive it was on 30-70 trades, classic small-sample noise that didn't hold across level types. Confirmation shrinks the sample without adding directional information.
Is the GEX regime (positive vs negative gamma) a useful filter?
Barely, and not in a tradeable way here. The character split is real but weak — the most-negative-gamma days lean slightly toward intraday continuation (59% vs 52%), positive-gamma days toward mean reversion. But when we gated real strategies by regime and compared to a shuffled (fake) regime, the shuffle scored as high or higher every time: opening-range breakout, 15-minute momentum, both. The regime label was decorative. The one place regime genuinely pays off is a narrow, specific open-momentum construction we already run live (Backdraft) — not the broad confluence stack people imagine.
So what actually works out of all this?
Plain intraday momentum exists — first-15-minute direction held to the close was positive over the full sample (t=2.7) — but it isn't improved by any of the overlays (a shuffled regime does as well), and it's period-concentrated: on a train/holdout split the 2019–mid-2023 half was flat (t=0.5) while the recent half carried it (t=2.5). It's directional drift in trending years, not a confluence edge. The honest takeaway: stacking weak or dead signals doesn't create edge — it multiplies the ways to fool yourself, and the impressive equity curve you get is almost always the artifact.