What Is a Trading Edge? Write the Hypothesis First
A trading edge is a falsifiable claim with a mechanism and a counterparty. How to write one, set kill criteria before you backtest, and why most ideas die.
Part 1 of 20 · How to Algo · Next: Bar data vs tick data
A trading edge is not a pattern on a chart. It is a claim that someone on the other side of your trades is systematically paying you, a reason why they have to, and a test that could prove you wrong. If you cannot write those three things down before you open the data, you are not developing an algorithm. You are searching for a curve, and the data will always give you one.
This series is about the process of building trading algorithms for futures and index options: research method, data, backtest engineering, statistics, costs, robustness, sizing and live operation. It contains no strategies to copy. It contains the mistakes we made building and killing our own, with the numbers each one faked. It expands the five steps of our algo-trading roadmap into twenty parts.
We start where the work starts: with a sentence, not a script.
The base rate is brutal, and that is fine
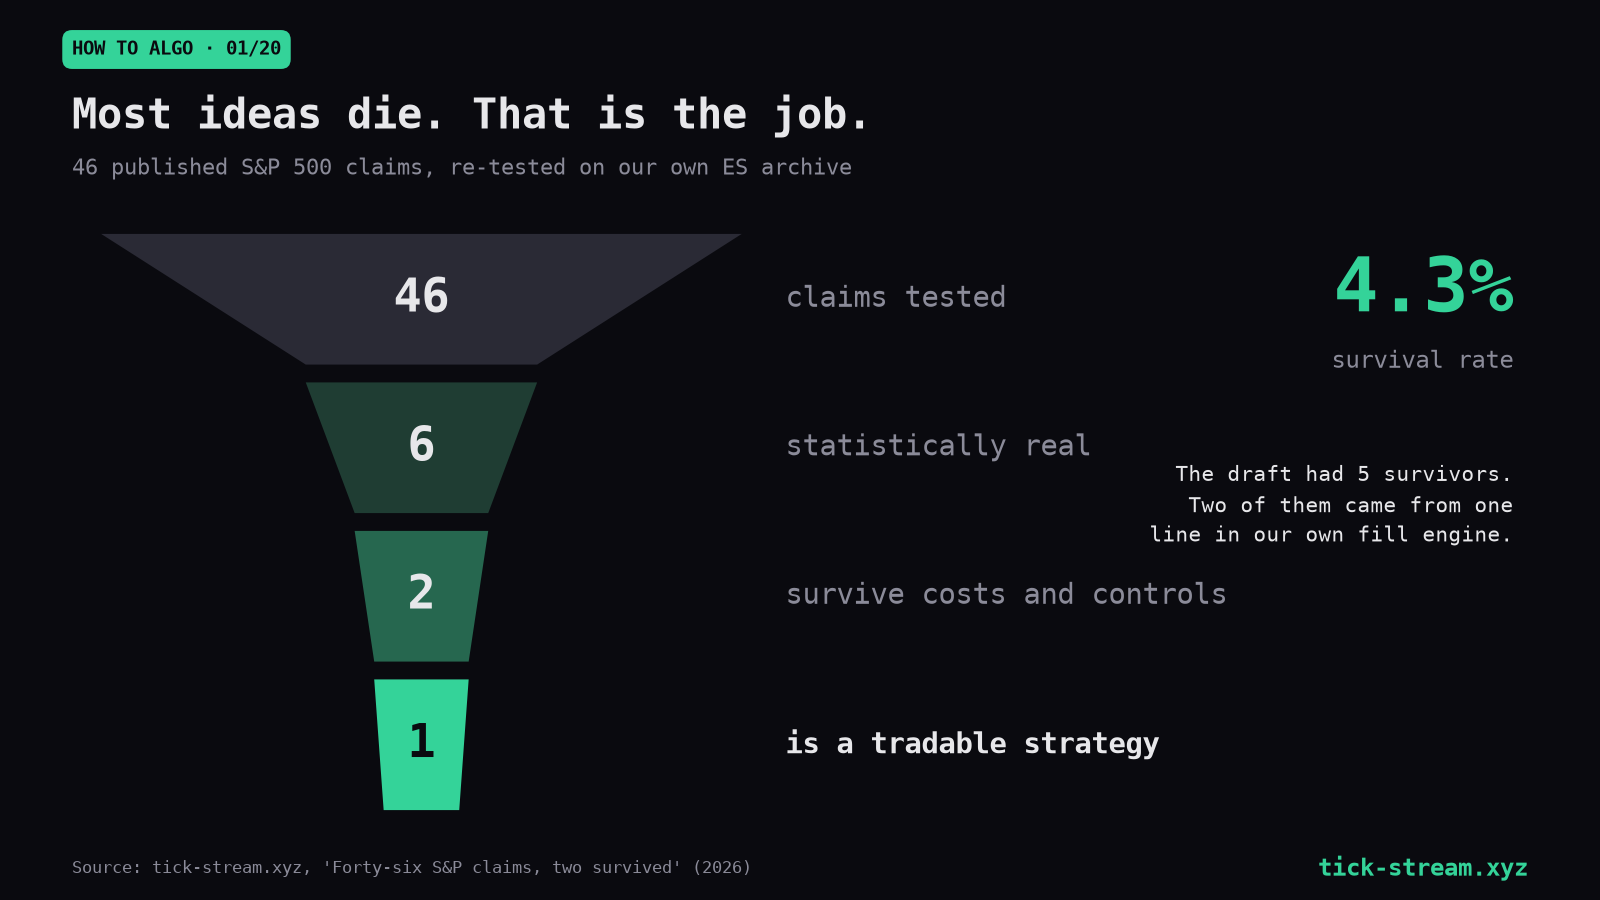
We recently re-tested 46 widely taught claims on our own S&P 500 archive: twelve and a half years of ES ticks, seven years of option chains and three months of order-book snapshots. Two survived their controls. Four were statistically real and could not be collected once we priced the trade you would have to place. Forty were dead. That is a survival rate of 4.3%.
Our Nasdaq research looks the same. Order blocks, fair value gaps, liquidity sweeps, value-area rules, volume profile nodes, footprint exhaustion, CVD divergence, opening-range fades, session “manipulation” models: each was mechanised, run with honest fills and real costs, and killed. Of seven signals we pulled from the options tape, six died in public. A handful of ideas survived, and most of those are modest.
None of this means research is hopeless. It means the default outcome of a test is death, and your process has to be built for that outcome. A researcher who expects most ideas to work will keep tweaking the ones that do not until something prints. A researcher who expects 4% will write the kill criteria first and move on quickly.
Three ingredients of an edge
Every edge we have seen survive has three parts you can state in plain language.
A counterparty. Somebody takes the other side of your trade at a price that is worse for them than fair, on average. Who? Market makers who must quote both sides. Option dealers who must hedge. Index funds that must rebalance. Hedgers who must roll. Traders who must cut risk at the close because their firm says so. If your answer is “other traders who are wrong”, ask why they stay wrong in the same direction for years.
A mechanism. Why does the counterparty pay? The best mechanisms are forced flow (participants who trade on a schedule or a constraint rather than on price), risk transfer (you are paid to hold a risk someone else wants to shed) and, more weakly, behaviour (systematic overreaction or underreaction that persists because it is uncomfortable to fade).
A measurable prediction. “Dealers short gamma amplify moves” predicts something you can measure: larger ranges after negative-gamma sessions. It does not predict direction. When we tested it on ES, the next session ranged 66.47 points after negative gamma against 38.74 after positive, while the correlation with direction was −0.0138. The mechanism said “volatility”, the data said “volatility”, and the trading idea that people actually sell, “gamma levels tell you where price turns”, died in four separate tests. The volatility finding survived because the hypothesis matched the mechanism.
Contrast that with the session model popular in ICT circles: Asia accumulates, London sweeps the Asian range, New York reverses. It names no forced participant. Over seven years of NQ we measured the correlation between London’s direction and New York’s return at −0.014, and fading the sweep lost money. The story was complete, the counterparty was missing, and so was the effect.
Write the hypothesis down first
Here is the template we use. It fits on half a page, and every field has to be filled in before any data is loaded.
| Field | What goes in it |
|---|---|
| Claim | One sentence, in the form “when X, then Y over horizon H” |
| Counterparty | Who pays, and why they keep paying |
| Market and data | Instrument, session, years, resolution, and why that resolution |
| Prediction | The number you expect to move, and in which direction |
| Control | What the result must beat: random entries, a shifted level, always-long |
| Costs | Commission and slippage per round trip, in ticks and dollars |
| Kill criteria | The results that end the line, stated as numbers |
| Split | Training years and holdout years, fixed now |
The reason to fill it in first is simple: after you have seen a result, every decision you make is fitted to that result. Which session to use, which years to exclude, which stop width is “reasonable”: once you know the answer, your judgement is no longer independent of it.
We learned the value of a pre-written kill rule on a machine-learning project on NQ. After weeks of work one configuration showed a positive result at t = +1.42 on 1,500 trades, not significant but tempting. Before running the confirmation, we wrote down the decision: run the identical method on ES with a barrier scaled to the same share of price; if ES is flat or negative, the Nasdaq result was chance. ES came back with the model beating its placebo by 0.59 ticks at t = +0.22. The line was closed that day. Without the written rule, the temptation would have been to “adapt the method for ES”, which is how a second chance turns into a twentieth.
What kill criteria look like
Kill criteria are useful only if a script can check them. Some of the ones we use most often, each covered in its own part of this series:
- Significance on the right unit. A t-statistic below 2 on daily-aggregated net P&L, not on individual trades that overlap. Part 10 explains why.
- The placebo test. Random entries with the same count, holding time, session and side mix beat the signal in more than 5% of runs. Part 12 covers how to build one that is fair.
- Sign stability. The result changes sign between the training years and the holdout. Part 13.
- Edge per trade. The average net trade is smaller than two or three ticks, so any extra slippage removes it. Part 8.
- Concentration. One year, one side or three trades carry most of the profit. Part 15.
- Search size. The result sits inside the range that the same parameter search produces on shuffled data. Part 11.
A good kill criterion is uncomfortable. If you write criteria that your idea will obviously pass, you have written a press release, not a test.
”Real” is not the same as “tradable”
Some hypotheses are confirmed and still dead. The S&P earns 71.1% of its full-session return while the cash market is closed, at t = 2.77 on our ES data. That is a real effect with a clear risk-transfer story. But a nightly round trip costs $29.50, which is about half of the gross figure, and the net series drops to t = 1.32. The overnight drift is true and not collectable by trading it nightly.
Order-book imbalance on ES is another: positive on 73 of 76 sessions, and worth $4.19 in the best case against a $12.50 cost to cross the spread. Real, robust, and reserved for whoever is already resting in the queue.
Your hypothesis therefore needs a fourth field in practice: “and the gross effect is at least several times my round-trip cost.” Write that down too.
Why most of your ideas should die
There is a quieter reason to expect a high kill rate. The ideas that reach you have already been filtered for being easy to explain and easy to sell. Easy to explain usually means visible on a chart. Visible on a chart usually means everyone has seen it, and what everyone can see is either priced in or was never there.
The ideas that survive tend to be boring to describe: buy short-term weakness in an index and hold for a few days; expect bigger ranges when dealers are short gamma. They are boring because the mechanism does the work, not the pattern.
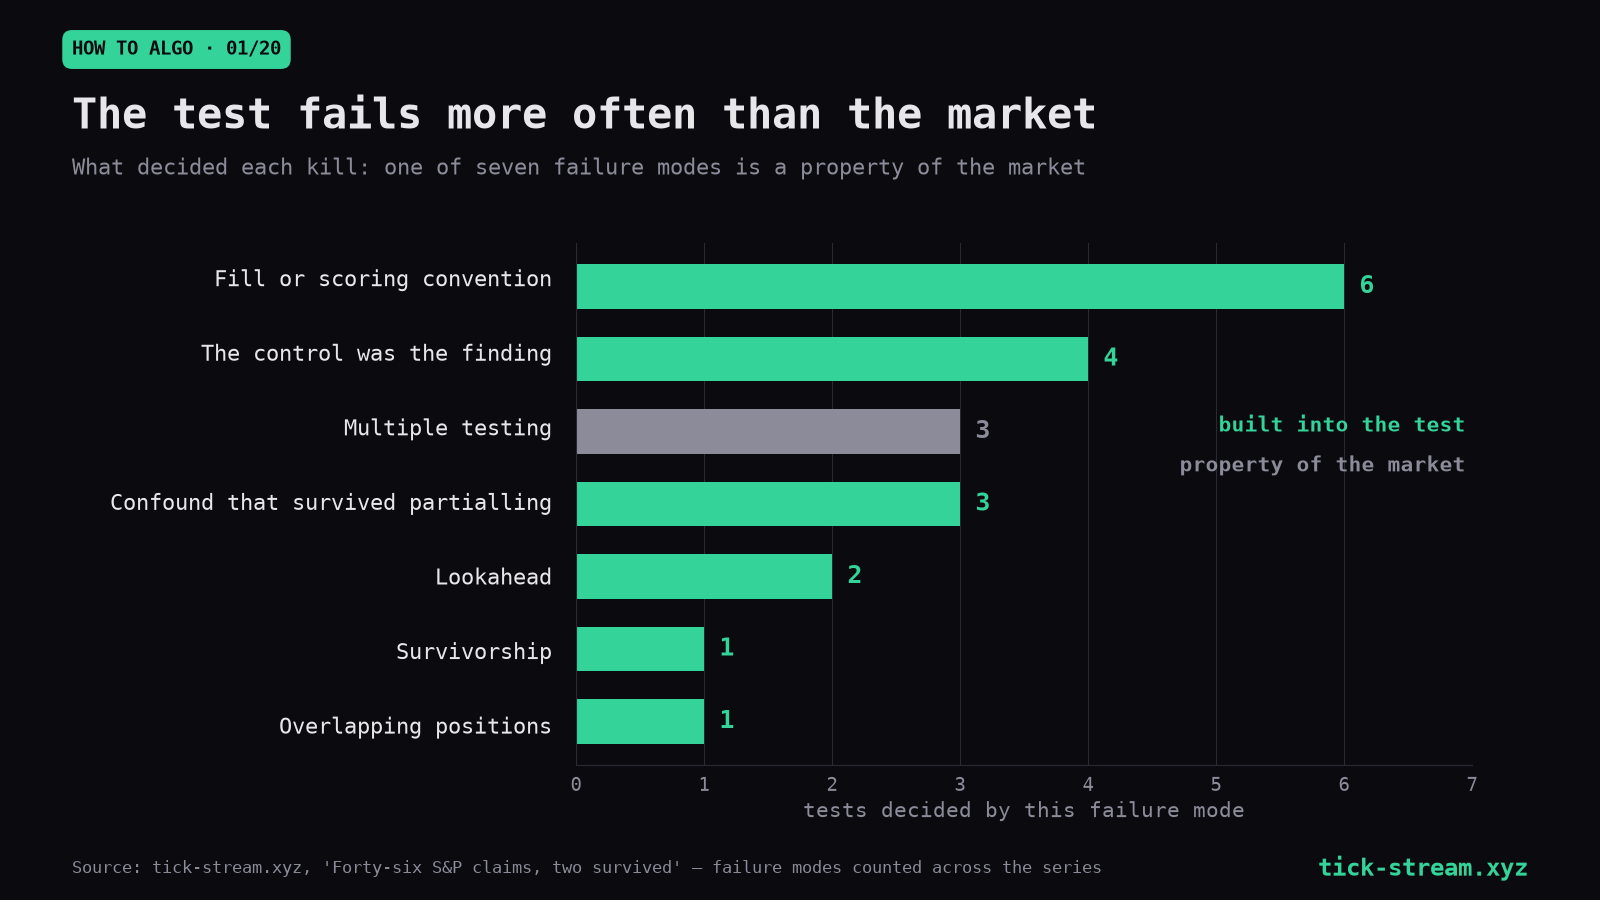
A high kill rate is also the only way to keep the survivors honest. If you kill quickly and cleanly, the few results that pass every check carry information. The chart below counts what decided those S&P kills: the most common failure modes were built into the test itself, a fill or scoring convention (6) and a control that turned out to be the finding (4). If you rescue every idea with one more filter, your final “edge” is the last of many attempts, and its statistics mean nothing. We will spend Part 11 on that arithmetic.
A worked example of the process, not of a strategy
Take a common retail claim: “large trades predict where price goes next.” Before touching data, the sheet reads:
- Claim: signed large-trade volume in a five-minute bar predicts the next bar’s direction.
- Counterparty: informed institutions whose orders leak information; the market catches up after their print.
- Prediction: positive correlation between signed large-trade volume and the next bar’s return, net of the same-bar move.
- Control: the same correlation for the bar that contains the trade (to separate leading from coincident), and a fade version.
- Kill: next-bar correlation indistinguishable from zero, or trading it loses after $29.50 per ES round trip.
The result on ES: +0.035 with the bar containing the trade, −0.004 with the next bar, and both following and fading the signal lost money. Large trades follow price; they do not lead it. Because the sheet existed, the decision took a minute. Without it, the next steps would have been “try a bigger size threshold”, “try only the cash session”, “try a three-bar horizon”, and twenty tries later something would have looked significant.
Checklist before you open the data
- Write the claim as “when X, then Y over horizon H”.
- Name the counterparty and the reason they keep paying.
- State the measurable prediction and its sign.
- Choose the control the result must beat.
- Put a number on round-trip costs, in ticks.
- Write the kill criteria as numbers a script can check.
- Fix the training and holdout years.
- Decide in advance what you will do if it fails, and make “stop” one of the options.
If the sheet is hard to fill in, the idea is not ready to test. That is a result too, and a cheap one.
Next, before any test can run, you need data at the right resolution. Part 2: Bar data vs tick data, and which resolution your algo actually needs.
Frequently asked questions
What is an edge in trading?
A repeatable reason why the price you trade at is, on average, better than fair, together with the identity of whoever is paying for that difference. If you cannot name the counterparty or the mechanism, what you have is a pattern, and patterns found in historical data are usually noise or a cost you have not priced yet.
How do you know if you actually have a trading edge?
Only after it passes tests you wrote down before seeing the data: a t-statistic of at least 2 on daily-aggregated net P&L, a matched placebo it beats, the same sign in training and holdout years, and a net edge of several ticks per trade. Of 46 widely taught claims we re-tested on our S&P 500 archive, two passed their controls and four were statistically real but not collectable after costs.
What should a trading hypothesis include before you backtest it?
A claim in the form 'when X, then Y over horizon H', the counterparty who pays and why, the market and data resolution, the measurable prediction, the control it must beat, round-trip costs, numeric kill criteria and a training/holdout split fixed in advance. In one of our machine-learning tests the pre-written rule closed the line the day the confirmation came back at t = +0.22.
Why do most trading strategy ideas fail?
The ideas that reach you were filtered for being easy to explain, which usually means visible on a chart, and what everyone can see is either priced in or was never there. Of the 46 claims we re-tested, 40 were dead, a survival rate of 4.3%. That describes the list we chose, not the whole field, but it sets the right expectation.
Who is on the other side of a profitable trade?
Usually someone who has to trade regardless of price: dealers hedging option books, funds rebalancing to a schedule, hedgers rolling contracts, or traders paying to get rid of risk. Narratives without a forced participant rarely survive. Our seven-year test of 'London sweeps, New York reverses' found a correlation of −0.014 between London's direction and the New York session.